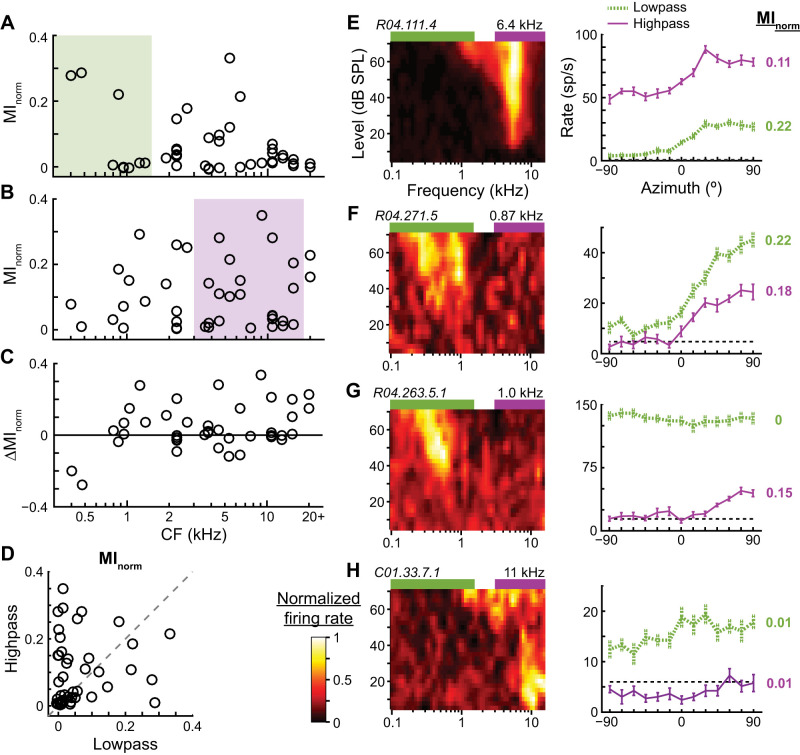
Fig. 4.
Directional sensitivity to low- and high-pass noise across the cochleotopic map of the central nucleus of the inferior colliculus (ICC). A and B: normalized mutual information (MInorm) vs. the characteristic frequency (CF) of each neuron in response to low (A; 0.1–1.5 kHz)- and high (B; 3–16 kHz)-pass noise at 70 dB SPL (n = 42). Colored rectangles indicate noise passbands. C: difference (Δ) of MInorm between high- and low-pass noise (high − low) vs. CF. D: MInorm of each neuron for low- vs. high-pass noise. Dashed line is unity line. E–H: frequency-level response areas (FRAs; left) and azimuth tuning curves (right) for 4 different ICC neurons. In each FRA, the color associated with firing rate is normalized to highest (white) and lowest (black) rates. Neuron ID and CF are at top left and top right, respectively, of each FRA. Green and purple rectangles above each FRA indicate low and high passbands, respectively. Azimuth tuning curves (mean ± SE) are shown in response to low- and high-pass noises. Dashed black lines indicate spontaneous rates. Normalized MI is shown on right of each curve, with color matched to curve.

