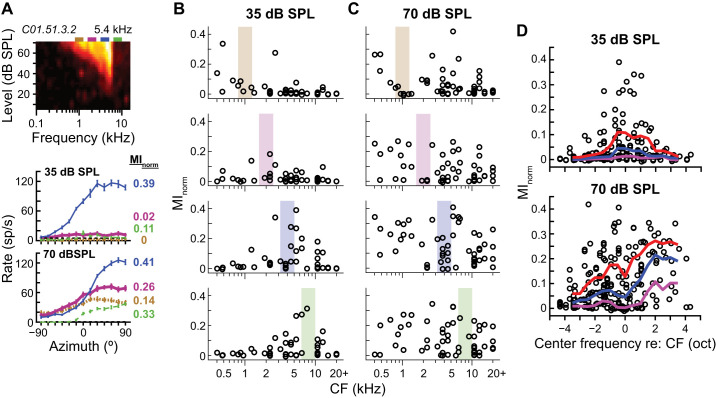
Fig. 5.
Localized vs. widespread transmission of directional information across the cochleotopic map. A: frequency-level response area (FRA; top) and azimuth tuning curves in response to narrowband noise (2/3 oct wide) at each of 4 center frequencies at 35 (middle) and 70 (bottom) dB SPL for 1 central nucleus of the inferior colliculus (ICC) neuron. Line type and color of azimuth tuning curve indicate center frequency: 1 (dotted tan), 2 (thick magenta), 4 (thin blue), and 8 (dashed green) kHz. Rectangles above the FRA indicate noise passbands, color-matched to the azimuth tuning curves. Normalized mutual information (MInorm) values indicated on right of each curve. B and C: MInorm vs. characteristic frequency (CF) of each neuron in response to narrowband noises with center frequencies of 1, 2, 4, and 8 kHz (top to bottom) at 35 (B; n = 46) and 70 (C; n = 54) dB SPL. Colored boxes indicate noise passbands. D: MInorm vs. narrowband center frequency relative to each neuron’s CF for 35 (top) and 70 (bottom) dB SPL. Data pooled over all center frequencies. Positive frequency values indicate that the noise band was higher than the neuron’s CF. Octave-wide, roving 25th, 50th. and 75th percentiles of the data indicated by purple, blue, and red curves, respectively.

