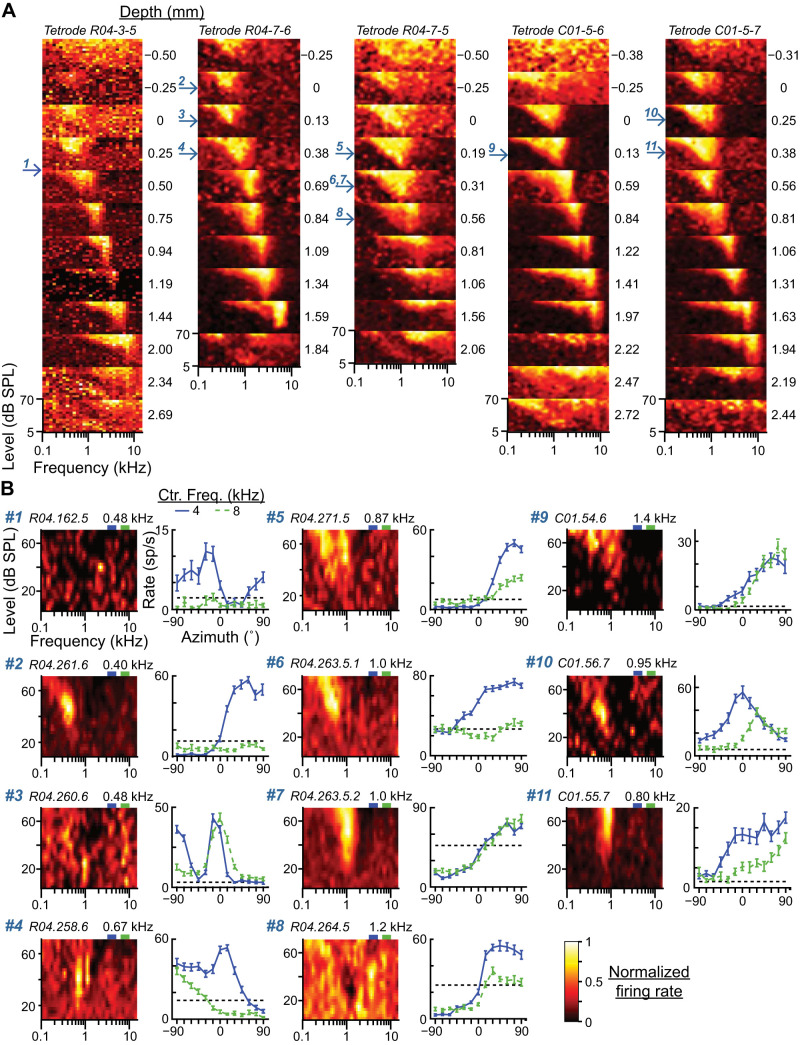
Fig. 6.
Cochleotopic locations of low-characteristic frequency (CF) neurons. A: multiunit frequency-level response area (FRAs) recorded from 5 different tetrodes (columns) at 10–12 different depths (plots within each column). Depth relative to the approximate dorsal border of the central nucleus of the inferior colliculus (ICC) is indicated on right of each plot. Tuning to frequency within the ICC systematically increases with depth. Arrows on left of panels indicate depths at which low-CF neurons were recorded, with numbers matched to the data in B. B: FRAs (left) and azimuth tuning curves in responses to narrowband noise at 4- and 8-kHz center frequencies (right) for each of the 11 low-CF neurons whose depths are indicated by arrows in A (corresponding number at top left). Dashed black lines in azimuth tuning plots indicate spontaneous rates. Neuron ID and CF are at top left and top right, respectively, of each FRA plot. Green and purple rectangles above each FRA indicate low and high passbands, respectively.

