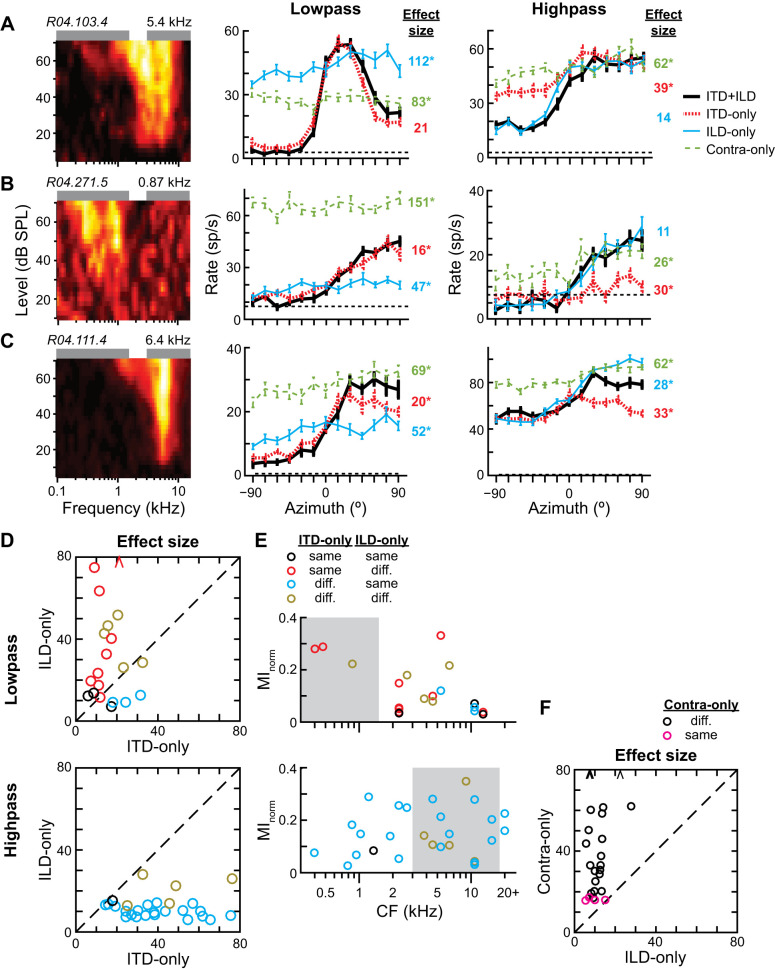
Fig. 8.
Interaural time difference (ITD) and interaural level difference (ILD) sensitivity primarily shape azimuth tuning curves in response to low- and high-pass noise, respectively. A–C: frequency-level response areas FRAs; left) and azimuth tuning curves in response to low-pass (center) and high-pass (right) noise at 70 dB SPL for 3 different central nucleus of inferior colliculus (ICC) neurons with strong directional sensitivity to both stimuli. Curves with different line types and color indicate binaural cue condition in virtual acoustic space: ITD+ILD, ITD-only, ILD-only, and contralateral-ear-only (contra-only). Effect sizes of Wald tests for differences between the ITD+ILD curve and each of the other curves are listed on right, color-matched to each binaural cue condition. *Statistically significant differences (Wald tests with correction for multiple comparisons, P < 0.01). D: plots of the effect size between ITD-only and ITD+ILD curves vs. the effect size between ILD-only and ITD+ILD curves within the same neuron for low-pass (top; n = 20) and high-pass (bottom; n = 27) noise at 70 dB SPL. Small effect size indicates that tuning curves were similar. Data only included for ITD+ILD curves with normalized mutual information (MInorm) > 0.03. Statistically significant differences between the ITD+ILD curve and either of the ITD-only or ILD-only curves indicated by circle color: neither different (black), only ILD-only different (red), only ITD-only different (cyan), both different (tan). Arrowhead data points indicate values beyond the axis. Dashed line is the unity line. E: MInorm vs. characteristic frequency (CF) of each neuron for azimuth tuning curves in response to low-pass (top) and high-pass (bottom) noise, color-coded to display significant differences between binaural cue conditions. Same data as in Fig. 4, A and B, except without values of MInorm < 0.03. F: plot of the effect size between ILD-only and ITD+ILD curves vs. the effect size between contralateral-ear-only and ITD+ILD curves within the same neuron for high-pass noise at 70 dB SPL (n = 27). Data only included for ITD+ILD curves with MInorm > 0.03. Statistically significant difference between the ITD+ILD curve and contralateral-ear-only curve indicated by circle color: difference (black), no difference (magenta).

