Fig. 10.
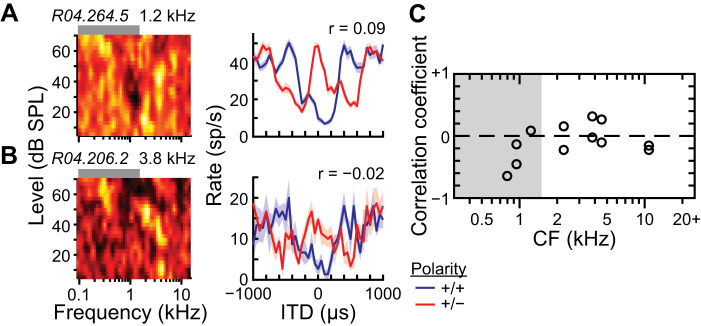
Sensitivity of high-characteristic frequency (CF) central nucleus of inferior colliculus (ICC) neurons to fine-structure interaural time difference (ITD) of low-pass noise. A and B: frequency-level response areas (FRAs; left) and ITD tuning curves in response to low-pass noise at 70 dB SPL (right; mean ± SE) for 2 different ICC neurons. Polarity of the left and right acoustic waveforms during measurement of ITD tuning indicated by different colored curves: same polarity (blue), opposite polarity (red). Correlation coefficient (r) between same- and opposite-polarity ITD tuning curves indicated at top right of each plot. C: correlation between same- and opposite-polarity ITD tuning curves vs. CF of each neuron (n = 12). Data only included for neurons with significant same-polarity ITD tuning (Kruskal–Wallis test, P < 0.01). Dashed line indicates zero correlation.

