. 2020 Aug 11;9:e61036. doi: 10.7554/eLife.61036

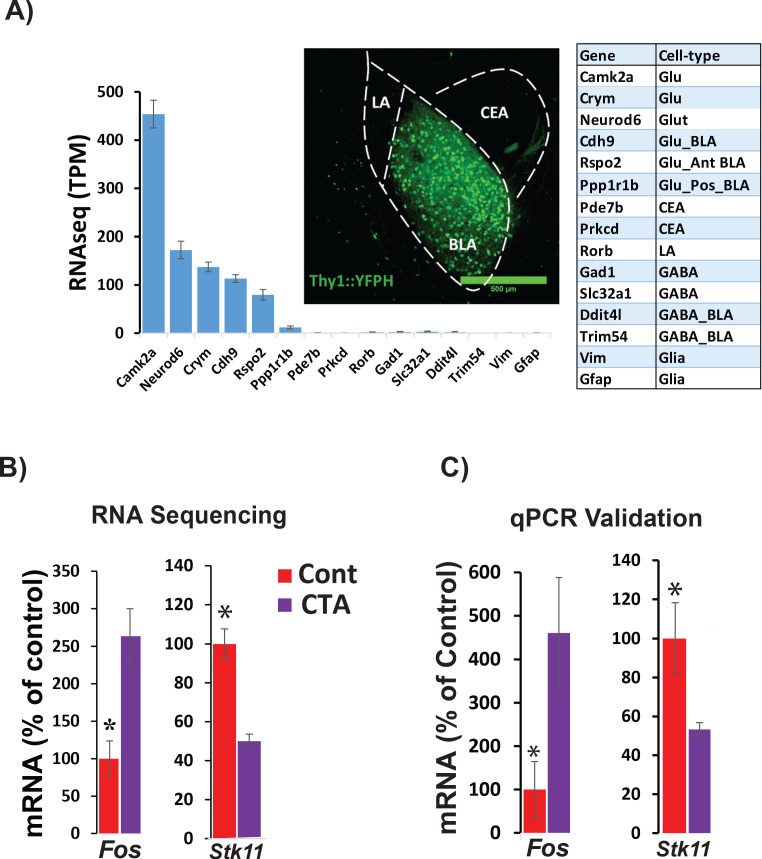
Figure 2. RNA sequencing from BLApn 4 hr following CTA training.

(A) BLApn were isolated from YFP-H mice following CTA or taste control (N = 4/group). Neurons (150-200) were manually sorted form coronal slices (LA-lateral amygdala; CEA-central amygdala). Abundant transcripts (histogram, averaged across both groups) are enriched for those expected in the population and depleted for those expressed in other nearby populations (Table 1) including GABAergic interneurons, glia, or neurons in LA or CEA; Sugino et al., 2006; Kim et al., 2016; Allen brain atlas). Glu- GABA-, glutamatergic, GABAergic neurons; AntBLA, PostBLA- Anterior and posterior portions of the BLA. TPM- transcript per million. (B) Among genes meeting robust criteria for differential expression (see Table 1) Stk11 and Fos were selected for further analysis, including qPCR confirmation (C) in separate experiments (N = 4/group; *p<0.05). See also Figure 2—source data 1 and Figure 2—figure supplements 14 and Tables 13.

Figure 2—source data 1. qPCR validation for Fos and Stk11 mRNA expression in YFPH+ neurons.
This data relates to Figure 2, panel C.

Figure 2.

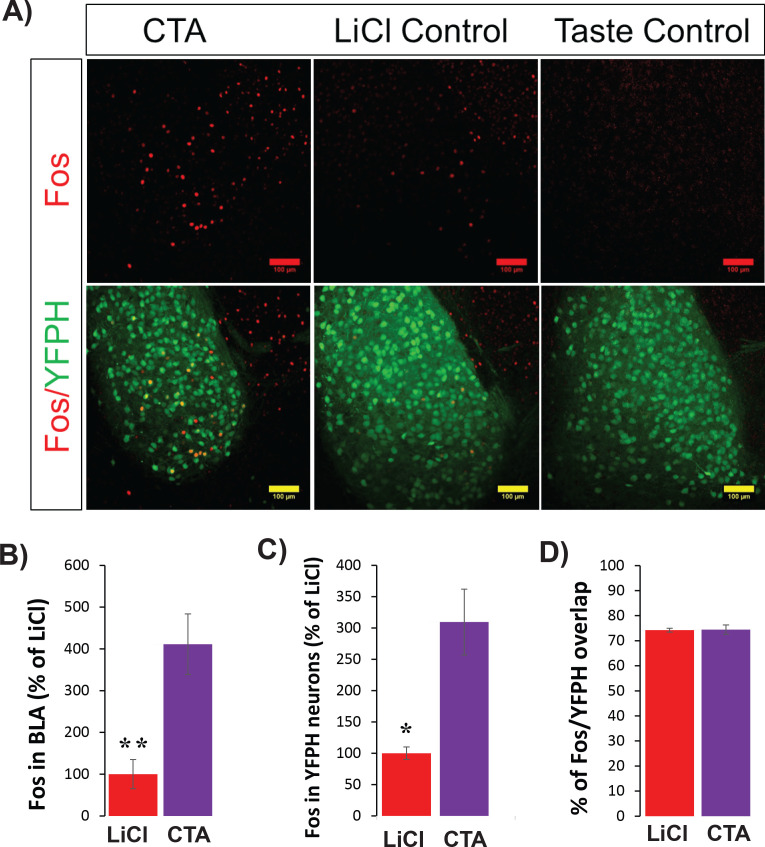
Figure 2—figure supplement 1. CTA increases C-FOS protein expression in BLApn including those in strain YFP-H.

Figure 2—figure supplement 1.

(A) Images of YFP+ neurons in the BLA (green) and C-FOS protein (red) 4 hr following CTA training, LiCl and taste controls. Note that the taste control group has no C-FOS+ signal and so is not shown in B-D. (B) CTA increased C-FOS expression in BLA relative to the LiCl and taste controls (F(2,11)=21.2; p=4×10⁻⁴; Post hoc (Bonferroni corrected) difference between CTA and LiCl groups: p=0.003, and p=4×10⁻⁴ between CTA and taste control groups, N = 4/group). (C) As in (B), but only for C-FOS overlapping YFP expression (f(2,11)=23.5: p=0.008, post hoc: CTA and taste control groups: p=4×10⁻⁴; N = 3–4/group). *p<0.05; **p<0.01. (D) In both CTA and LiCl control conditions, the expression of C-FOS protein was similarly localized to YFP+ neurons (74.4% for CTA and 74.2% for LiCl control). See also Figure 2—figure supplement 1—Source datas 12.
Figure 2—figure supplement 1—source data 1. FOS protein counts in BLA 4 hr following CTA training and LiCl control.
This data relates Figure 2—figure supplement 1 panel B.
Figure 2—figure supplement 1—source data 2. FOS protein counts in BLA YFPH+ neurons 4 hr following CTA training and LiCl control.
This data relates Figure 2—figure supplement 1 panel C.
Figure 2—figure supplement 2. STK11 protein expression following CTA training.
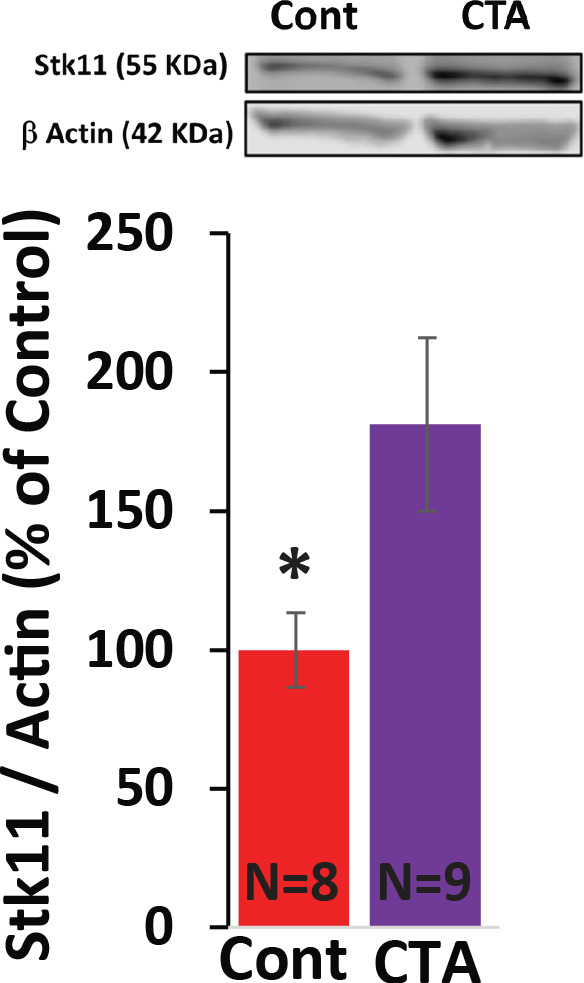
Figure 2—figure supplement 2.

YFP-H mice were trained for CTA or received a taste control and 4 hr later the anterior BLA (guided by YFP expression) was sub-dissected and used for immunoblotting with antibodies raised against STK11 and actin (as loading control). CTA increased the expression of STK11 (t(15)=2.28; p=0.037, N = 8/9 per group). *p<0.05. See also Figure 2—figure supplement 2—source data 1.
Figure 2—figure supplement 2—source data 1. STK11 protein levels in the BLA 4 hr following CTA training or taste control.
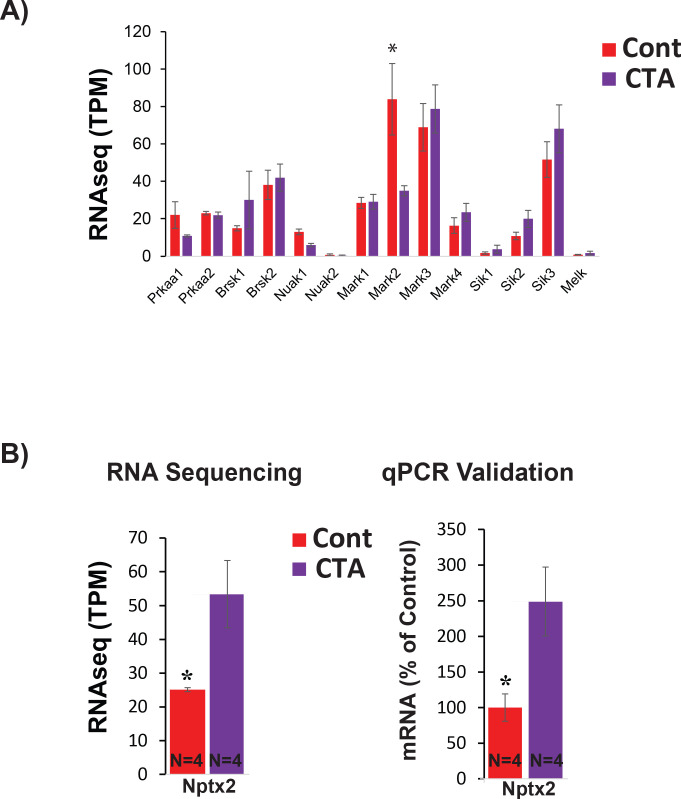
Figure 2—figure supplement 3. BLApn express known downstream targets of STK11 and C-FOS.

Figure 2—figure supplement 3.

(A) BLApn transcript levels of known downstream substrates of STK11, the members of the AMP-related kinase family (Lizcano et al., 2004). RNA sequencing from BLApn 4 hr following CTA training. Note that Mark2 mRNA expression is reduced in taste control mice relative CTA-trained mice (N = 4/group; *p<0.05); TPM- transcripts per million. (B) Nptx2, a known target of transcriptional regulation by C-FOS in neurons (Malik et al., 2014), increased following CTA. RNA sequencing (left) and qPCR validation (right) from BLApn 4 hr following CTA training. (N = 4/group; *p<0.05).
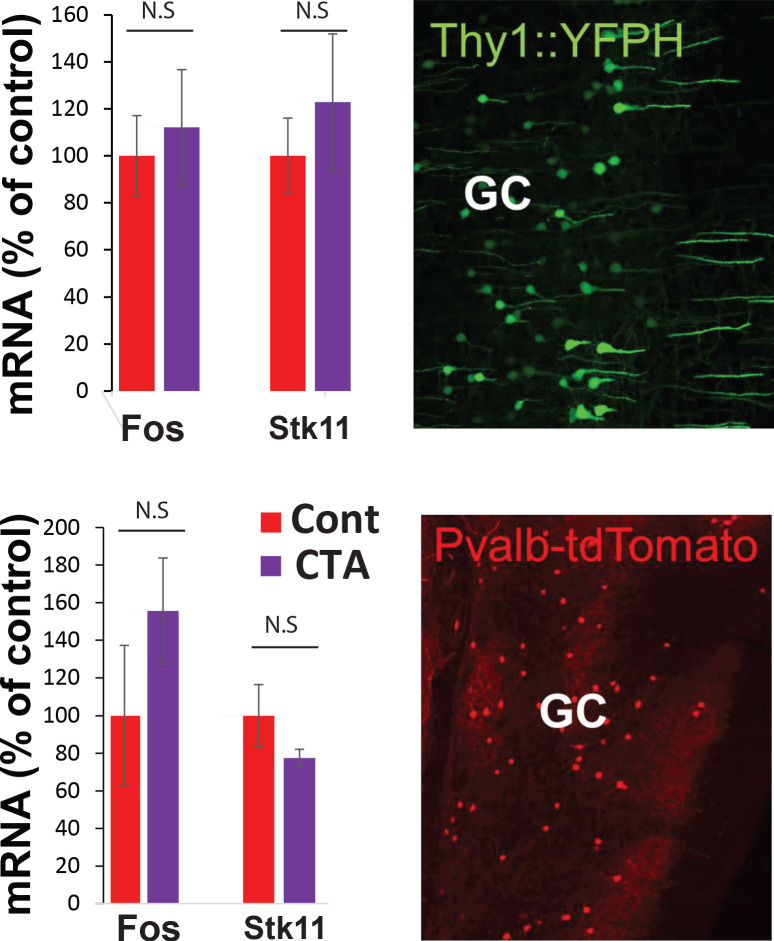
Figure 2—figure supplement 4. RNA sequencing from GC.

Figure 2—figure supplement 4.

Top. YFP-H L5 pyramidal neurons and Pvalb-tdTomato-positive interneurons in the GC. Fos and Stk11 did not differ significantly between CTA and taste control groups.