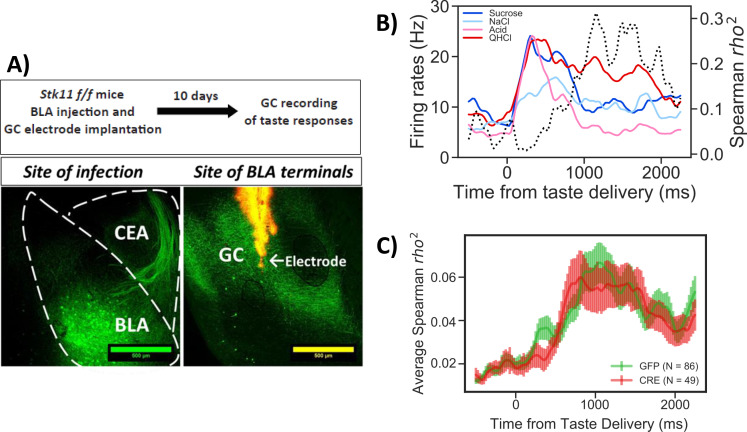
Figure 5. Stk11 deletion in BLApn does not affect taste palatability coding in the GC.
(A) The BLA of Stk11f/f mice was infected bilaterally with Cre or control viruses. The ventral GC, where BLA projections terminate (Haley et al., 2016) was implanted with a multi-electrode array 10 days later to record GC taste responses to a battery of four tastes differing in their hedonic value, the palatable sucrose and sodium-chloride and the aversive critic acid and quinine (Levitan et al., 2019). Images show BLA injection site (left) and labeled BLA terminals in the ventral GC co-localized with the site of dye-labeled electrodes (right). (B) PSTHs (colored lines) from a representative GC neuron in a GFP-injected control mouse that responded significantly to all tastes. Dashed line represents the magnitude of the rank correlation between firing rates and behaviorally measured palatability obtained previously in separate experiments (Levitan et al., 2019). (C) Correlation coefficients averaged across all recorded units in GFP (control) and Cre-injected mice. As revealed in a two-way ANOVA, palatability correlations in both groups rise steeply between 800 and 1000 ms with no significant difference between genotypes (F(1,133)=0.13, p=0.72) or interaction (p=0.99). See also Figure 5—figure supplement 1.


