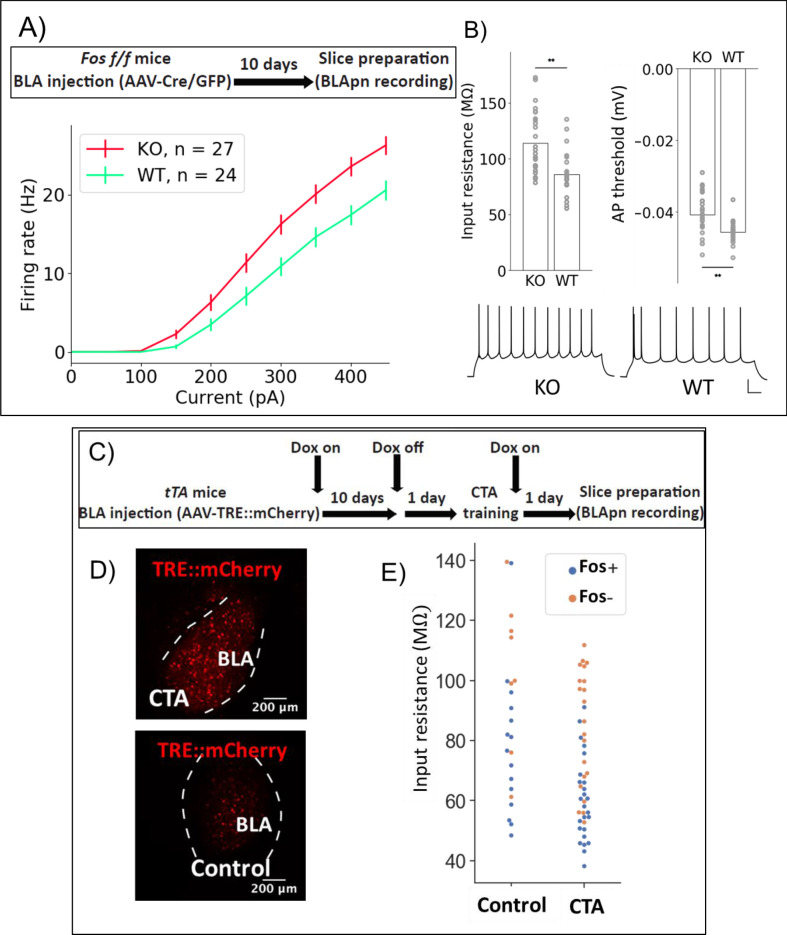
Figure 7. Fos deletion and CTA have opposing effects on resting input resistance.
(A,B) Whole-cell patch clamp recordings obtained from BLApn in ex vivo slices of Fosf/f mice 10 days after injection of Cre or control virus. Fos-KO neurons exhibit increased firing in response to current injection compared to Fos-WT neurons. (A) Average frequency-current (FI) curves. Two-way mixed ANOVA revealed a significant main effect of knockout (F(1,49) = 8.79, p=0.005) and current (F(9,441) = 419.4, p=6×10−210) on firing rate, along with a statistically significant interaction (F(9,441) = 8.2, p=2.57×10⁻¹¹). Post-hoc pairwise comparisons showed that the firing rates of Fos-KO neurons were significantly greater than those of Fos-WT neurons in response to current injections from 150 to 450 pA (p<0.05). (B) Differences in input resistance (F(1) = 10.62, p=0.0025) and action potential threshold (F(1) = 6.82, p=0.013) between Fos-KO and Fos-WT neurons were also significant. Traces show sample responses to 250 pA current steps. Scale bar: 100 ms, 20 mV. (C) Tet-dependent labeling of Fos expressing neurons (Reijmers et al., 2007) during CTA training. Fos::tTa mice injected with AAV-TRE::mCherry received food with 40 ppm Doxycycline (Dox) to suppress reporter expression. One day prior to CTA training, Dox was removed. Acute slices were prepared 24 hr following CTA (Saccharin+lithium) or control (Saccharin+saline) training. (D) MCherry labeled neurons in the BLA. (E) Input resistances of Fos+/- neurons in the BLA, following CTA training and taste-only control experiments. Two-way ANOVA reveals that neurons from CTA animals have lower input resistance than those from control animals (F(1,65) = 10.26, p=0.0021) and that Fos+ neurons have lower input resistance than Fos- neurons (F(1,65) = 23.64, p=7.5×10⁻⁶). Post-hoc tests show that among Fos+ neurons, those in CTA animals have lower input resistance (p=0.015), while among Fos- neurons, there was no significant difference between CTA and control animals (p=0.1). Differences between Fos+ and Fos- neurons did not reach post-hoc significance in either the CTA (p=0.25) or control animals (p=0.12) considered alone. See also Table 5.

