. 2020 Aug 11;9:e61036. doi: 10.7554/eLife.61036

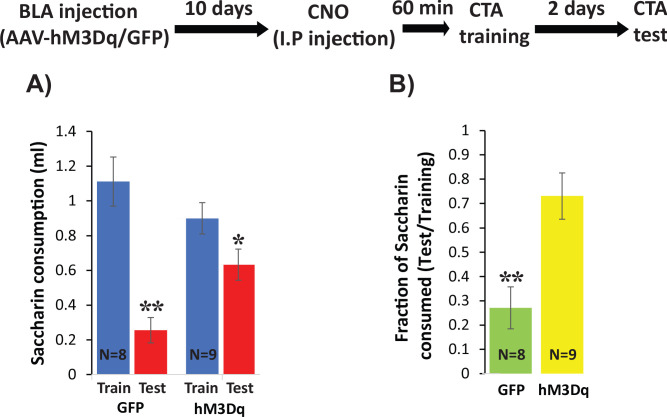
Figure 8. Increasing excitability using hM3Dq DREADD in BLApn during CTA training impairs CTA learning.

Stk11f/f mice were infected with Camk2α::hM3Dq or Camk2α::GFP control viruses 10 days before CTA training. Mice received systemic CNO (0.3 mg/kg) 60 min before training and were tested for CTA memory 48 hr later. (A) Control mice had greater reductions in saccharin consumption between testing and training sessions than hM3Dq mice. Mixed two-way ANOVA revealed a significant training effect and a significant interaction between training and treatment (training: F(1,16) = 32.6, p=3.2×10⁻⁵; treatment: F(1,16) = 0.63, p=0.44; interaction: F(1,16) = 8.97, p=0.009). This indicates that the effect of training depends on the treatment condition. Post hoc analysis revealed that although both GFP injected mice (N = 8) and hM3Dq injected mice (N = 9) developed CTA indicated by reduced saccharin consumption (GFP: p=0.001; hM3Dq: p=0.019), hM3Dq injected mice drank significantly more saccharin during the test then GFP mice (p=0.005). There was no significant difference in the consumption of saccharin during training (p=0.227). (B) The strength of CTA learning was expressed as the fraction of saccharin consumed between testing and training. GFP controls consumed only 22% during the test, relative to training, but hM3Dq mice consumed 72% and this difference was significant (t(15)=3.96; p=0.001). *p<0.05, **p<0.01. See also Figure 8—source datas 12 and Figure 8—figure supplement 1.

Figure 8—source data 1. Saccharin consumption (ml) during CTA training and test.
This data relates to Figure 8 panel A.
Figure 8—source data 2. Fraction of saccharin consumed (Test/Training).
This data relates to Figure 8 panel B.

Figure 8.

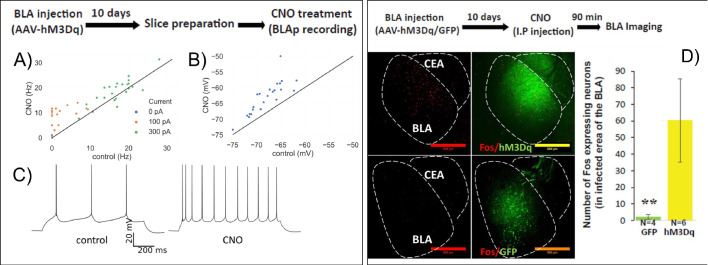
Figure 8—figure supplement 1. HM3Dq DREADD increases BLA activity.

Figure 8—figure supplement 1.

(A–C) Whole-cell patch clamp recordings from BLA neurons in acute brain slices following in vivo infection with AAV-CamKIIa::HM3Dq. Firing rate (A), example in C) in response to 1 s current steps and resting membrane potential (B) measured before (control) and 5 min after (CNO) bath application of 0.1 µM CNO. (A) A repeated measures ANOVA revealed a significant main effect of CNO application (F(1,27) = 22.9, p=5.4 E-5) and current (F(2,54) = 355.4, p=8.3×10⁻³²) on firing rate, along with a statistically significant interaction (F(2,54) = 8.2, p=2.57×10⁻¹¹). Post-hoc pairwise comparisons showed that firing rates of neurons were significantly higher during the CNO treatment compared to control in response to 100 pA (p=5×10⁻⁷) and 300 pA (p=0.012) input. (B) Resting membrane potentials of neurons are significantly higher than in control (paired sample t-test, t = −8.5, p=2×10⁻⁸). (C) Sample trace of spike trains in current clamp with 100 pA stimulation of the same neuron in CNO and control conditions. (D) BLA was infected with AAV-CamKIIa-HM3Dq or GFP as control. 10 days later mice were injected with CNO and C-FOS protein expression in the infected area in the BLA was measured 90 min later. Left. Representative images of C-FOS/HM3Dq and C-FOS/GFP. Right. CNO treatment increases C-FOS expression in the infected area in the BLA (N = 4/6; Mann–Whitney: Z = − 2.76; p=0.006). **p<0.01.