

Abstract
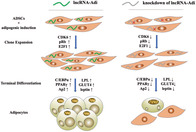
Adipogenesis participates in many physiological and pathological processes, such as obesity and diabetes, and is regulated by a series of precise molecular events. However, the molecules involved in this regulation have not been fully characterized. In this study, we identified a long noncoding (lnc)RNA, lncRNA‐Adi, which is highly expressed in adipose tissue‐derived stromal cells (ADSCs) that are differentiating into adipocytes. Knockdown of lncRNA‐Adi impaired the adipogenic differentiation ability of ADSCs. Moreover, lncRNA‐Adi was found to interact with microRNA (miR)‐449a to enhance the expression of cyclin‐dependent kinase (CDK)6 during adipogenesis. The mechanism by which lncRNA‐Adi regulates adipogenesis was determined to involve an lncRNA‐Adi‐miR‐449a interaction that competes with the CDK6 3′ untranslated region to increase CDK6 translation and activate the pRb‐E2F1 pathway to promote adipogenesis. These findings provide valuable information and a new study angle to search for therapeutic targets against metabolic disorders such as obesity and diabetes.
Keywords: adipogenesis, adipose tissue‐derived stromal cells, lncRNA‐Adi, long noncoding RNA, pRb‐E2F1 pathway
Here, we screened out a novel lncRNA, which was named lncRNA‐Adi, that highly expressed in adipogenic‐induced adipose tissue‐derived stromal cells (ADSCs). Then, knockdown of lncRNA‐Adi impaired the adipogenic differentiation ability of ADSCs. Finally, we verified that lncRNA‐Adi could protect CDK6 from degradation by competitively interacting with miR‐449a, to improve CDK6 translation level and activate pRb‐E2F1 pathway, which is crucial to promoting adipogenesis.
Significance statement.
This study found a new lncRNA, which was named lncRNA‐Adi, that highly expressed in adipogenic‐induced ADSCs. Furthermore, lncRNA‐Adi could competitively interact with miR‐449a, which protects CDK6 from degradation by miR‐449a, to improve CDK6 translation level and activate pRb‐E2F1 pathway, which is crucial to cell proliferation in the early stage of adipogenesis, to promote adipogenesis. These findings not only revealed the function and mechanism of lncRNA‐Adi in regulating adipogenesis but also, more importantly, could provide valuable information and a new study angle in the future to search for therapeutic target in fighting against metabolic disorders such as obesity and diabetes.
1. INTRODUCTION
The prevalence of obesity caused by unhealthy lifestyles such as excessive consumption of sweetened beverages and food and reductions in physical activity is sharply increasing worldwide. 1 , 2 By 2030, the number of people predicted to be overweight and obese will reach 2.16 billion globally. 3 Excess weight and obesity are important risk factors for many chronic diseases such as cardiovascular disease and type 2 diabetes, which are major sources of morbidity and mortality. 4
Clinically, obesity manifests as excessive adipose tissue accumulation throughout the body, which is the result of pathologically accelerated adipogenesis. During this process, adipose‐derived stem cells (ADSCs) in adipose tissue proliferate and differentiate into adipocytes containing lipid droplets to store energy. 5 , 6 Therefore, an understanding of the mechanism regulating adipogenesis is important to combat excess weight gain and obesity.
Adipogenesis is the process by which ADSCs differentiate into adipocytes, which includes three primary phases. The first involves the commitment of ADSCs to the adipocyte lineage. In the second phase of mitotic clonal expansion (MCE), committed growth‐arrested ADSCs reenter the cell cycle, and undergo several rounds of cell division. In the final phase of terminal differentiation (TD), adipocytes mature as their genes are widely expressed and lipid droplets accumulate. 5 , 7 This sequential process is governed by a precise and complex regulatory network involving transcription factors, signaling molecules, and noncoding RNAs. 8 , 9 , 10 , 11 , 12
Although previous studies of these regulatory molecules have greatly advanced our understanding of adipogenesis regulation, many questions remain unanswered. For instance, the function of the MCE stage is unclear, for which little is known about the role of target mRNA degradation by miRNA.
In recent years, long noncoding (lnc)RNAs have been shown to have epigenetic regulatory functions in a variety of biological processes including X chromatin inactivation, p53‐mediated apoptosis, developmental contexts, and cell differentiation. 13 , 14 For example, linc‐MD1 was shown to be a competitive endogenous RNA for miR‐133 and miR‐135 targets during myoblast differentiation, 15 the heart‐associated lncRNA Braveheart was required for the cardiovascular lineage commitment of mouse embryonic stem cells, 16 and lnc‐DC was essential for dendritic cell differentiation. 17 Some studies have also demonstrated that lncRNAs indeed have a function on adipogenesis. For example, lncRNA Plnc1 could promote adipogenic differentiation by regulating PPARγ. 18 LncRNA GAS5 could inhibit adipogenic differentiation of bone marrow mesenchymal stem cells by modulating the miR‐18a/CTGF axis. 19 However, these just reveal the tip of the iceberg of functions of lncRNAs on adipogenesis. 20 With amounts of novel lncRNAs identified, 21 we hypothesized that some lncRNAs which were not reported previously might have specific roles in adipogenesis.
To address this, we used full transcriptome microarrays to detect the expression profiles of undifferentiated and adipogenic‐induced ADSCs. We found that lncRNA‐Adi showed expression differences between the two groups and had a notable position in the TF‐lncRNA‐mRNA network. LncRNA‐Adi was specifically and highly expressed in the MCE stage of adipogenesis. RNA interference (RNAi)‐mediated lncRNA‐Adi knockdown blocked adipogenic differentiation of ADSCs, suggesting that lncRNA‐Adi was indispensable for adipogenesis. LncRNA‐Adi was located in the cytoplasm of ADSCs and bound miR‐449a, an important regulatory molecule of cell proliferation. LncRNA‐Adi was also a competitive endogenous RNA for cyclin‐dependent kinase 6 (CDK6) mRNA, which both share a binding site for miR‐449a, in activation of the pRb‐E2F1 pathway and the promotion of free E2F1 in ADSC induction. Therefore, the mechanism of lncRNA‐Adi regulation of adipogenesis was proposed as the binding of lncRNA‐Adi with miR‐449a to influence CDK6‐pRb‐E2F1 axis activation in the regulation of cell division and PPARγ expression during adipogenesis.
2. MATERIALS AND METHODS
2.1. Ethics and informed consent
This study followed the guidelines in the Declaration of Helsinki and the International Guiding Principles for Animal Research and Law for Management of Experimental Animal. The Research Ethics Board established by the Ethics Committee of the West China Hospital of Stomatology, Sichuan University, examined the proposed research protocol for this project, and found it to be ethically acceptable.
2.2. Cell culture and differentiation
Inguinal fat tissue was aseptically obtained from the groin of 2‐week‐old female Wistar rats (24 healthy donors in total) following anesthesia by an intramuscular injection of Nembutal at 25 mg/kg according to International Guiding Principles for Animal Research. The soft tissue and small vessels were removed, and ADSCs were isolated by first removing extracellular matrix through incubating adipose specimens at 37°C for 1 hour with 0.25% type I collagenase. The compound was then centrifuged at 1000 rpm for 8 minutes, and then washed three times with phosphate‐buffered saline (PBS). The pellet was resuspended in alpha‐modified eagle medium (α‐MEM) with 10% fetal bovine serum (FBS) and incubated in a humidified atmosphere of 5% CO2 at 37°C. For adipogenic differentiation, passage 2 (P2) ADSCs were seeded at a density of 1 × 10⁵ cells/cm2 in six‐well plates and washed with PBS twice when the cells reached 70%~80% confluence. The cells were maintained in the adipogenic stimulation medium, which consisted of α‐MEM with 20% FBS containing 0.5 mM 3‐isobutyl‐1‐methylxanthine, 1 μM dexamethasone, and 5 μg/mL insulin (MDI). The adipogenic stimulation medium change was performed every 3 days. For osteogenic differentiation, P2 ADSCs were seeded at a density of 1 × 10⁵ cells/cm2 in six‐well plates and cultured in α‐MEM with 10%FBS for 2 days and washed with PBS twice. The cells were maintained in the osteogenic stimulation medium consisting of α‐MEM containing 10% FBS 10 mM β‐glycerophosphate, 0.01 μM dexamethasone, 50 μg/mL ascorbic acid and 0.01 μM 1, 25‐dihydroxyvitamin D3. The osteogenic stimulation medium change was performed every 3 days. For chondrogenic differentiation, P2 ADSCs were seeded at a density of 1 × 10⁵ cells/cm2 in six‐well plates and cultured in α‐MEM with 10%FBS for 2 days and washed with PBS twice and digested with 0.25% trypsin. The digested medium was centrifuged at 1000 rpm for 5 minutes. The pellet was resuspended in 15 mL centrifuge tube with 0.5 mL chondrogenic stimulation medium purchased from Cyagen (China) and was centrifuged at 1000 rpm for 5 minutes, then incubated in a humidified atmosphere of 5% CO2 at 37°C. The chondrogenic stimulation medium change was performed every 3 days. For neurogenic differentiation, P2 ADSCs were seeded at a density of 1 × 10⁵ cells/cm2 in six‐well plates coated with poly‐L‐lysine/laminin and cultured in α‐MEM with 10%FBS for 2 days and washed with PBS twice. The cells were maintained 24 hours in the neurogenic stimulation medium containing 200 μM butylated hydroxyabisole, 5 μg/mL insulin, 2 mM sodium valproate, 10 μM Forskolin, 1 μM hydrocortisone, 25 mM potassium chloride, and 2 mM L‐glutamine.
2.3. Oil red O staining
After culturing with adipogenic stimulation medium for 7 days, the ADSCs were stained with oil red O. Briefly, induced cells were washed three times with PBS then fixed in 4% paraformaldehyde at room temperature for 30 minutes. After washing with PBS three more times, the cells were stained with oil red O solution (60% oil red O stock solution containing 0.5% oil red O in isopropanol and 40% deionized water) for 30 minutes, washed three times with PBS, rinsed with 60% isopropanol, then observed with a microscope.
2.4. Microarrays
Total RNA was extracted with TRIzol according to the manufacturer's protocol. It was then labeled, amplified, and hybridized with the RAT GENE 2.0 ST Array (Affymetrix) following the Affymetrix WT Plus Reagent Kit Manual and Affymetrix GeneChip Expression Analysis Technical Manual. The Affymetrix Expression Console implementation of RAM was used for quantile normalization and background correction. All transcripts level files were imported into Affymetrix Expression Console and normalized by the quantile method. Combat software was used to adjust the normalized intensity to remove batch effects. A random variance model t test was applied to discriminate differentially expressed genes between ADSCs group and adipogenic‐induced ADSCs group. After false‐discovery rate analysis, differentially transcripts were selected only if P value <.05 and the change in expression was ≥1.5‐fold. Hierarchical clustering was performed using Cluster. N = 3 samples per group were used.
2.5. Bioinformatics analysis
Gene ontology (GO) analysis was used to explore the functions of differentially expressed genes identified in this study. GO analysis organizes genes into hierarchical categories and can uncover gene regulatory networks on the basis of biological processes and molecular functions (http://www.geneontology.org). Pathway analysis was applied to place differentially expressed genes according to Kyoto Encyclopedia of Genes and Genomes (KEGG; http://www.genome.jp/kegg/). Fisher's exact tests were used to identify GO category and pathways, and the threshold of significance of GO and pathways were defined by the P value. P values were calculated for the enrichments of GO and pathways. Gene coexpression networks were constructed to identify interactions among genes and lncRNAs. Gene coexpression networks were built according to the normalized signal intensity of individual genes. The data were preprocessed by using the median gene expression value of all transcripts expressed from the same coding genes. Then, the data for differentially expressed mRNAs and lncRNAs was screened and removed from the dataset. For each pair of genes analyzed, we calculated the Pearson correlation and chose pairs with significant correlations to construct the network. To make a visual representation, only the strongest correlations (≥0.7) were included in the visual networks. The coexpression networks were drew using Cytoscape. The lncRNA‐mRNA network was first built to identify the interactions between coding genes and lncRNAs in ADSCs group and adipogenic induction group. In each network, degree centrality of each lncRNA in network was calculated to determine the relative importance of lncRNA in network. The degree difference of each lncRNA between two networks was calculated and sorted in descending order. The 19 lncRNAs having big degree difference (>0.01) between two networks (ADSCs group and adipogenic induction group) were finally screened out.
2.6. Quantitative RT‐PCR
Quantification of RNA was performed with MMLV reverse transcriptase and SYBR‐green‐based qPCR with an ABI PRISM7900 system. qPCR was performed by primary incubation at 95°C for 10 minutes followed by 40 cycles of 95°C for 10 seconds and 60°C for 60 seconds. Relative RNA expression was normalized to the levels of actin and calculated with the ΔΔCt method. The primer pairs are given in Supplementary Table 1. N = 3 samples per group were used.
2.7. RNAi‐mediated knockdown of lncRNA‐Adi
The lncRNA‐Adi short hairpin (sh)RNA pLPDS019 vector and Mission nontargeting control shRNA pLPDS019 vector were purchased from Novobio. Lentiviral packaging of these constructs was carried out in 293T cells. In brief, 6 × 10⁶ cells were seeded in 10‐cm dishes in Dulbecco's modified Eagle medium (DMEM) medium containing 10% FBS 1 day before transfection. A total of 3 μg of either lncRNA‐Adi shRNA pLPDS019 vector or Mission nontargeting control shRNA pLPDS019 vector were mixed with 9 μg packaging mix in 1.5 mL Opti‐MEM, and then mixed with lipofectamine 2000 to obtain complexes. Cells were cultured with complexes in a humidified atmosphere of 5% CO2 at 37°C for 6 hours; then, the medium was replaced with DMEM medium containing 10% FBS. After 48 hours, supernatants were collected, centrifuged at 3000 rpm for 10 minutes, and filtered through 0.45 μm filters. The collected supernatants were concentrated by ultracentrifugation with 50 000g at 4°C for 2 hours. The virus particle pellet was resuspended in DMEM and frozen at −80°C until use.
2.8. Cell proliferation and apoptosis
For the cell proliferation assay, the ADSCs transfected with nothing were collected as a blank control (BC), and transfected with small interfering (si)RNA targeting nothing as a negative control (NC), and transfected with siRNA targeting lncRNA‐Adi as a knockdown group (lnc‐Adi‐KD). N = 3 samples per group were used. The ADSCs in BC, NC, and lnc‐Adi‐KD groups were respectively cultured with adipogenic induction. Cells were harvested at days 0, 3, 5, and 7 of induction and seeded at 100 μL per well in 96‐well culture plates, and CCK‐8 assays were performed with Cell Counting Kit‐8 following the manufacturer's guidelines. In brief, cells were cultured with adipogenic induction medium for 0, 3, 5, and 7 days, then 10 μL CCK‐8 was added to each well, and the cells were further cultured in a humidified atmosphere of 5% CO2 at 37°C for 2 hours. The absorbance value was then measured at 450 nm. For the cell apoptosis assay, ADSCs (BC), ADSCs (NC), and ADSCs (lnc‐Adi‐KD) were cultured with adipogenic induction, and cells were harvested at days 0, 3, 5, and 7 of induction and resuspended in 100 μL binding buffer, then stained with 5 μL 7‐ADD for 10 minutes in dark condition and added into 400 μL of binding buffer. They were then stained with 1 μL Annexin V‐PE for 10 minutes in the dark and immediately analyzed by flow cytometry.
2.9. RNA fluorescence in situ hybridization
ADSCs were seeded in 24‐well plates and induced with adipogenic stimulation medium for 3 days. After washing three times with PBS, cells were fixed with 4% paraformaldehyde for 10 minutes followed by permeabilization with 0.5% Triton X‐100 for 5 minutes at 4°C. After washing three times with PBS, cells were incubated with probes overnight at 37°C. They were then washed three times with 4 × saline sodium citrate (SSC) containing 0.1% Tween‐20 at 42°C followed by once each with 2 × SSC and 1 × SSC. They were washed a further three times with PBS, incubated with 4′,6‐diamidino‐2‐phenylindole dihydrochloride for 10 minutes, and then washed three more times with PBS. Cells were then observed under a fluorescence microscope. LncRNA‐Adi probes were synthesized by Ribobio Co, Ltd.
2.10. Dual luciferase reporter assay
HEK293 cells were seeded into each well of 96‐well plate and cultured in a humidified atmosphere of 5% CO2 at 37°C to reach 70% confluence. They were then cotransfected with 0.21 μg reporter or mutant reporter (pMIR‐Report), 0.021 μg internal control pRL‐TK Renilla luciferase plasmid, and rno‐miR‐449‐5p mimic or NC miRNA mimic molecules (final concentration, 50 nM) with 50 μL Lipofectamine 2000. Lysates were harvested 48 hours after transfection, and reporter activity was measured with the Dual Luciferase Assay (Promega). Data were normalized by dividing firefly luciferase activity with that of Renilla luciferase as previously reported. N = 3 samples per group were used.
2.11. Cell cycle analysis
ADSCs (BC) and ADSCs (lnc‐Adi‐KD) were cultured with adipogenic induction for 24 hours and then cells were collected respectively, rinsed with PBS, and fixed for 2 hours with ice‐cold ethanol at 4°C. They were then centrifuged at 1000 rpm for 5 minutes, and the pellets were rinsed with cold PBS. Next, 0.5 mL stain buffer was added to the cells and incubated for 30 minutes at 37°C, and they were immediately analyzed by flow cytometry. Data were assessed with the FlowJo software. N = 3 samples per group were used.
2.12. Western blot analysis
ADSCs were scraped off the culture plates, washed with PBS, and lysed with RIPA lysis buffer (1 mM MgCl2, 10 mM Tris‐HCl pH 7.4, 1% Triton X‐100, 0.1% sodium dodecyl sulfate [SDS], and 1% Nonidet P40 cocktail). The proteins were separated with 10% SDS‐polyacrylamide gel electrophoresis, and transferred to cellulose membranes. The membranes were incubated overnight with the following primary antibodies: anti‐CDK6 (Abcam, UK), anti‐CDC25A (Abcam), anti‐pRb (Abcam), anti‐E2F1 (Abcam), and anti‐β actin (Bioss, China). They were then immunoblotted with an antirabbit horseradish peroxidase‐conjugated secondary antibody (Abcam). Immunoreactivity was visualized with enhanced chemiluminescence and analyzed with the Quantity One system.
2.13. Statistics
Statistical significance of all molecular analyses in this study was assessed by Student's t test. P ≤ .05 was labeled as *, P ≤ .01 was labeled as **, and P ≤ .001 was labeled as ***. All the P‐adjusted values are given in Supplemental Information.
2.14. Data availability
The raw microarray data have been deposited in the Gene Expression Omnibus database (accession code GSE119796). All microarray experiments were performed as independent triplicates, and the microarray data referenced during the study are available in a public repository (https://www.ncbi.nlm.nih.gov/geo/).
3. RESULTS
3.1. lncRNA‐Adi might have functions during adipogenesis
ADSCs displayed a typical fibroblast‐like morphology (Figure 1A). Multilineage potential and cell surface marker detection based on the International Federation for Adipose Therapeutics and Science and the International Society for Cellular Therapy 22 showed that ADSCs had good pluripotency and homogeneity (Figure 1B,C). With a standard cocktail induction medium of 3‐isobutyl‐1‐methylxanthine, dexamethasone, and insulin (MDI), ADSCs could be induced into mature adipocytes by day 7 (Figure 2A).
FIGURE 1.
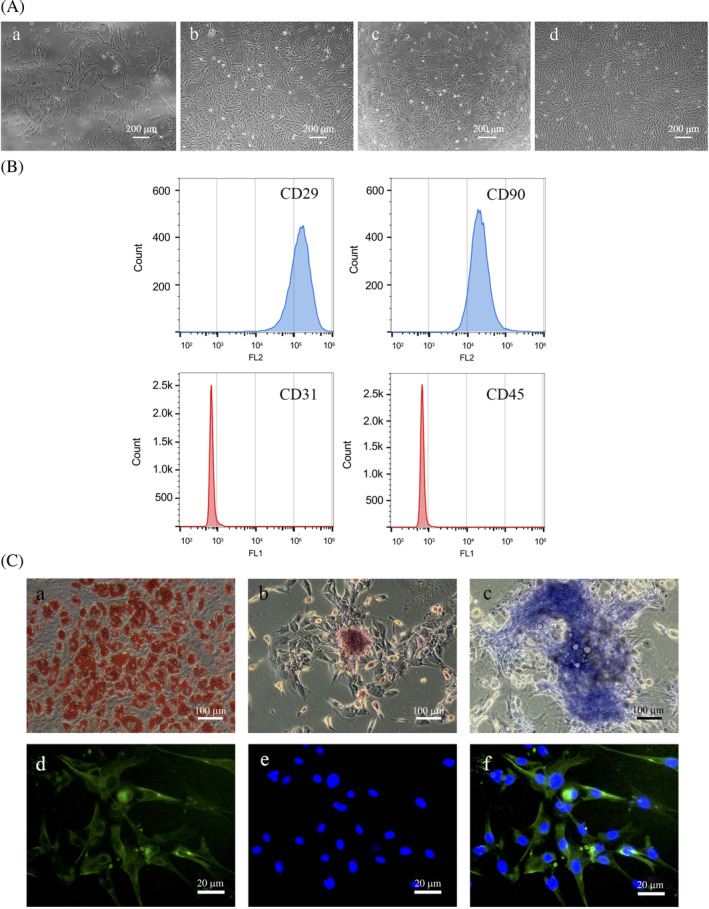
Identification of adipose tissue‐derived stromal cell (ADSC) pluripotency and homogeneity, and adipogenic induction. A, ADSCs displayed typical fibroblast‐like morphology. Primary cell culturing for 1 day (a), 4 days (b), 7 days (c), and 10 days (d). B, ADSC surface markers were analyzed by flow cytometry. CD29(+) 99.9%, CD90(+) 99.9%, CD31(−) 3.41%, and CD45(−) 1.73%. C, The identification of ADSC multiple differentiation potential. (a) Oil red O staining showing ADSCs differentiating into adipocytes in which the lipid droplets were stained red. (b) Positive alizarin red staining showing calcifying nodules formed after ADSC induction into osteoblasts. (c) Toluidine blue staining showing ADSCs differentiating into chondrocytes. (d) Immunofluorescent staining with NF antibody after ADSC with neurogenic induction for 1 day. (e) DAPI staining of ADSC with neurogenic induction for 1 day. (f) Merged image of (d) and (e)
FIGURE 2.
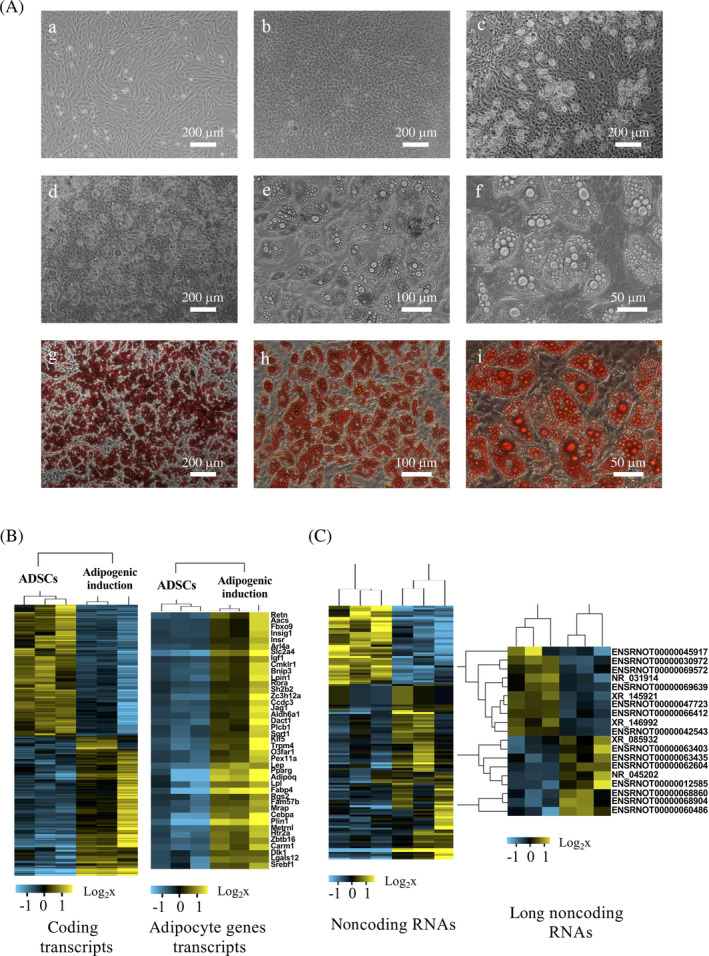
Overview of transcriptome microarrays. A, Cell morphology changing during adipogenic induction. (a) Uninduced adipose tissue‐derived stromal cells (ADSCs). (b) ADSCs with adipogenic induction for 3 days. (c) ADSCs with adipogenic induction for 5 days. (d–f) ADSCs with adipogenic induction for 7 days under magnifications of 40, 100, and 200. (g–i) Oil red O staining of ADSC with adipogenic induction for 7 days under magnifications of 40, 100, and 200. B, Cluster of coding transcripts (left) and adipocyte gene transcripts (right). Adipocyte differentiation‐related mRNAs such as Slc2a4, Fabp4, PPARγ, and CEBPα were unsurprisingly significantly upregulated in adipogenic‐induced ADSCs (right). C, Cluster of noncoding transcripts (left) and long noncoding (lnc)RNAs (right)
Transcriptome microarrays were used to detect the transcript expression profiles of undifferentiated ADSCs and ADSCs exposed to adipogenic induction medium for 7 days (adipogenic‐inducted ADSCs). The expression of 2117 mRNAs were significantly changed (fold change ≥1.5), with 1088 upregulated and 1029 downregulated (P‐adjusted values are showed in Table S2). Adipocyte differentiation‐related mRNAs such as Slc2a4, Fabp4, PPARγ, and CEBPα were unsurprisingly significantly upregulated in adipogenic‐inducted ADSCs (Figures 2B). The main functions of the differentially expressed genes were analyzed by GO analysis (P‐adjusted values are showed in Table S3). The enriched functions of upregulated mRNAs contained fatty acid beta‐oxidation, fatty acid metabolic process, etc, whereas the enriched functions of downregulated mRNAs contained positive regulation of cell proliferation, cell adhesion, etc (Figure S1). Moreover, KEGG pathway analysis showed that the upregulated genes were mainly involved in the metabolic pathways (Figure S2).
By differential expression analysis, 19 lncRNAs were screened out which have expression differences between undifferentiated ADSCs and adipogenic‐induced ADSCs (fold change ≥1.5; Figure 2C). We then constructed signal networks and lncRNA‐mRNA networks in undifferentiated ADSCs and adipogenic‐induced ADSCs (Figures S3 and S4). By calculating the differences in parameters of lncRNAs in the two networks, we found that 18 of the 19 lncRNAs showed differences in the two networks, which was nearly in line with the differential screening results.
To further identify lncRNAs that are specifically expressed during adipogenesis, we built the TF‐lncRNA‐mRNA network (Figure S5). By calculating and ordering the difference value of degrees which represented the interaction relationship of lncRNAs and genes in undifferentiated ADSCs and adipogenic‐induced ADSCs networks, we found that XR_593805 (ENSRNOT00000012585 in the Ensembl database, referred to as lncRNA‐Adi hereafter) had a higher difference value, suggesting it might function in adipogenesis. Next, we located lncRNA‐Adi at position 33075109 to 33076725 on rat chromosome 8, with a length of 1617 bp and represents a conserved nucleotide (phyloP 1.03) in 20 species.
3.2. lncRNA‐Adi is specifically highly expressed in MCE stage of ADSC adipogenic differentiation
To understand the role of lncRNA‐Adi during adipogenesis, we examined its expression at different time points (days 0, 1, 3, 5, and 7) by quantitative real‐time (qRT)‐PCR. LncRNA‐Adi expression was upregulated on days 1, 3, 5, and 7 in ADSCs receiving adipogenic induction compared with undifferentiated ADSCs (day 0), peaking on days 1 and 3 when ADSCs were undergoing MCE (Figure 3A,B).
FIGURE 3.
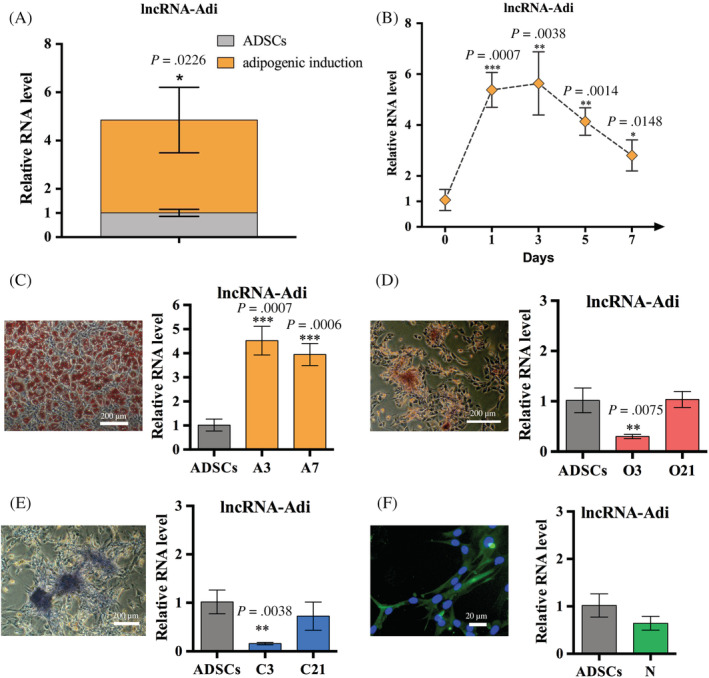
Long noncoding (lnc)RNA‐Adi is specifically and highly expressed in mitotic clonal expansion of adipose tissue‐derived stromal cell (ADSC) adipogenic differentiation. A, The expression level of lncRNA‐Adi was significantly upregulated in ADSCs with adipogenic induction for 7 days compared to uninduced ADSCs detected by qRT‐PCR; n = 3. B, Expression pattern of lncRNA‐Adi during adipogenic induction detected by qRT‐PCR in which the expression of lncRNA‐Adi was strikingly upregulated in days 1 and 3 and then was slowly downregulated in days 5 and 7 while the expression level of lncRNA‐Adi was still higher than that of uninduced ADSCs (day 0); n = 3. C, Relative expression of lncRNA‐Adi in ADSCs with adipogenic induction for 3 days when the induction began and 7 days when the mature adipocytes formed; n = 3. D, Relative expression of lncRNA‐Adi in ADSCs with osteogenic induction for 3 days when the induction began and 21 days when the calcifying nodules formed; n = 3. E, Relative expression of lncRNA‐Adi in ADSCs with chondrogenic induction for 3 days when the induction began and 21 days when the chondrogenic induction completed; n = 3. F, Relative expression of lncRNA‐Adi in ADSCs with neurogenic induction for 1 day when the neurogenic induction completed; n = 3
We then induced ADSCs to differentiate in different directions and detected lncRNA‐Adi expression levels. LncRNA‐Adi was expressed at low levels in osteoblast‐like, chondrocyte‐like, and neuron‐like cells induced from ADSCs, and highly expressed in adipocytes induced from ADSCs (Figure 3C–F). These results showed that lncRNA‐Adi was specifically expressed during the adipogenic differentiation of ADSCs.
3.3. lncRNA‐Adi is indispensable for the adipogenic differentiation of ADSCs
To identify the functional contribution of lncRNA‐Adi in adipogenesis, we performed RNAi‐mediated loss‐of‐function experiments to block lncRNA‐Adi expression. The ADSCs in BC, NC and lnc‐Adi‐KD groups were cultured in α‐MEM with 10% FBS for 2 days and then inducted with adipogenic stimulation medium for 7 days. As expected, lncRNA‐Adi expression was significantly suppressed in lnc‐Adi‐KD ADSCs during adipognesis (Figure 4A,B), indicating that the siRNA‐transfected model could be used in loss‐of‐function lncRNA‐Adi studies.
FIGURE 4.
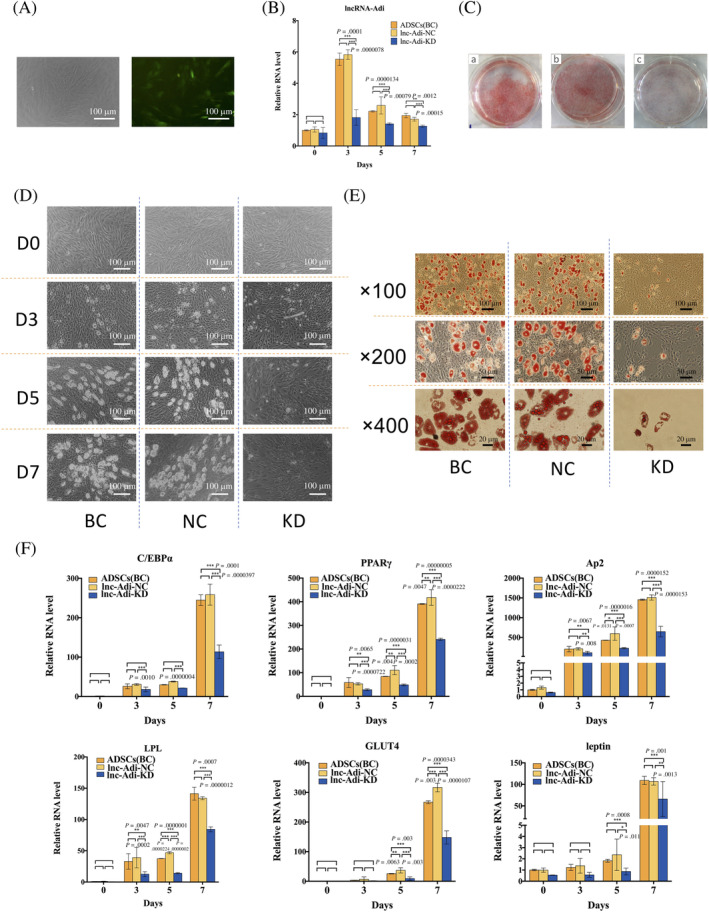
Long noncoding (lnc)RNA‐Adi is indispensable for adipogenic differentiation of adipose tissue‐derived stromal cells (ADSCs). A, GFP positive cytoplasm image (right) showed that packaged lentivirus with lncRNA‐Adi shRNA sequence successfully transfected into ADSCs. B, ADSCs transfected with lentivirus with lncRNA‐Adi shRNA sequence (lnc‐Adi‐KD) expressed little lncRNA‐Adi during adipogenic induction compared to ADSCs transfected with nothing (ADSCs(BC)) and with lentivirus with nontargeting control sequence (lnc‐Adi‐NC), which verified that the effects of interfering lncRNA‐Adi expression in lnc‐Adi‐KD group ADSCs; n = 3. C, Oil red O staining of ADSCs in BC, NC, and KD groups at day 7. D, Microscopic observation of cell morphology changes in BC, NC, and KD groups at days 0, 3, 5, and 7 after adipogenic induction. E, Microscopic observation of oil red O staining of ADSCs in BC, NC, and KD groups during adipogenic induction at days 0, 3, 5, and 7 under magnifications of 100, 200, and 400. F, Expression level of key adipocytes genes including C/EBPα, PPARγ, aP2, LPL, GLUT4, and leptin in BC, NC, and KD groups during adipogenic induction at days 0, 3, 5, and 7; n = 3
We induced ADSCs in BC, NC, and lnc‐Adi‐KD groups into adipocytes with MDI adipogenic induction medium, and observed the differentiation process on days 0, 3, 5, and 7. Compared with ADSCs in BC and NC groups, those in the lnc‐Adi‐KD group lacked the typical morphological changes that occurred during adipogenesis, such as changing into a rounder and more dense phenotype and slower growth on day 3 and less lipid droplet accumulation on days 5 and 7 (Figure 4D). After 7 days of adipogenic induction, the oil red O staining was used to evaluate the lipid accumulation. In BC and NC groups, a large area of cells was stained red by the naked eye, which diffuse cells were stained in the lnc‐Adi‐KD group (Figure 4C). Microscopic observations were in agreement with these findings (Figure 4E).
To further evaluate the molecular changes in BC, NC, and si‐lncRNA‐Adi ADSCs groups during adipogenesis, we determined the expression of six important adipocyte genes, C/EBPα, PPARγ, aP2, LPL, GLUT4, and leptin. These genes were significantly downregulated in the si‐lncRNA‐Adi group compared with BC and NC group during adipogenesis (Figure 4F). These results showed that interfering with the expression of lncRNA‐Adi in ADSCs blocked adipogenic differentiation, indicating that lncRNA‐Adi was indispensable for the adipogenic differentiation of ADSCs.
3.4. LncRNA‐Adi is located in the cytoplasm and is a decoy of miR‐449a
To elucidate the mechanism by which lncRNA‐Adi regulating adipogenesis, we investigated its location and predicted its possible mechanism by bioinformatics. RNA fluorescence in situ hybridization (FISH) located lncRNA‐Adi in the cytoplasm (Figure 5A), which was supported by detection of high lncRNA‐Adi expression in ADSC cytoplasm fractions on days 3 and 7 of adipogenesis, compared with little expression in nuclear fractions at the same time point (Figure 5B).
FIGURE 5.
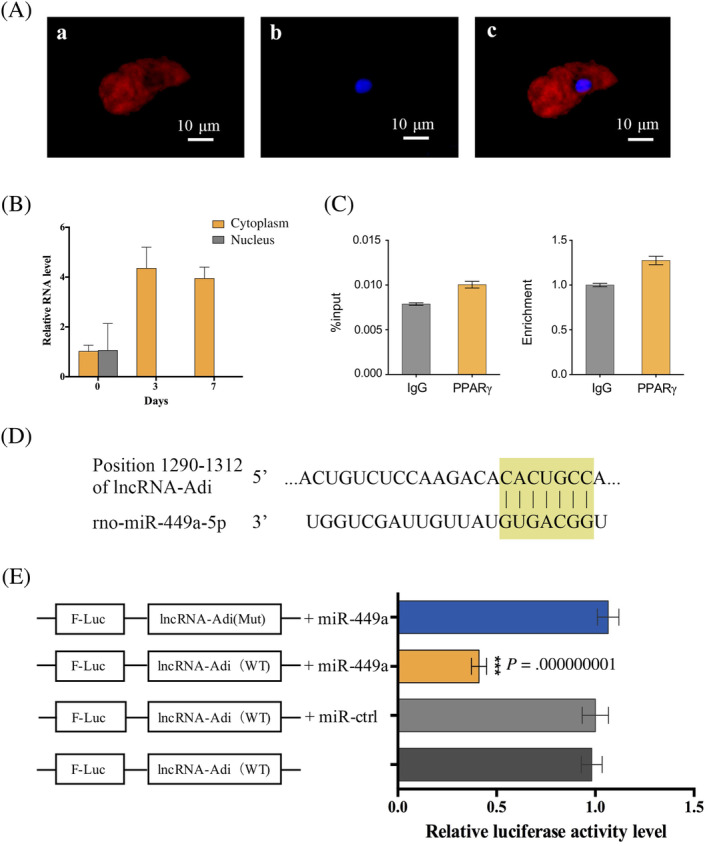
Long noncoding (lnc)RNA‐Adi locates in the cytoplasm and is a decoy of miR‐449a. A, RNA fluorescence in situ hybridization (FISH). (a) lncRNA‐Adi probe detection. (b) DAPI staining. (c) Merged image of (a) and (b). B, Relative lncRNA‐Adi RNA levels in cytoplasm and nuclear fractions in uninduced adipose tissue‐derived stromal cells (ADSCs; day 0) and adipogenic‐induced ADSCs (days 3 and 7). C, RNA binding protein immunoprecipitation (RIP) result showed that the binding ability with lncRNA‐Adi had no difference between IgG and PPARγ; n = 3. D, Predicted target site of lncRNA‐Adi binding with miR‐449a by Targetscan. E, Dual luciferase reporter assay to verify that lncRNA‐Adi could bind with miR‐449a; n = 3
Previous studies indicated that cytoplasm‐located lncRNAs could function as: (a) a Staufen 1 decoy to prevent degradation of related mRNA; (b) a transcriptional factor decoy to regulate related gene expression; or (c) an miRNA decoy to prevent the degradation of target mRNAs. 23 We used RepeatMasker to analyze lncRNA‐Adi sequence information for the presence of short interspersed nuclear elements (SINEs) such as Alu elements, which are essential for the Staufen 1 decoy function. The absence of SINEs in lncRNA‐Adi indicated that it does not function as a Staufen 1 decoy. We next simulated the lncRNA‐Adi secondary structure using RegRNA 2.0, and predicted a PPARγ binding domain. However, RNA binding protein immunoprecipitation revealed no significant difference in lncRNA‐Adi binding with PPARγ and control IgG, suggesting that no binding relationship exists between PPARγ and lncRNA‐Adi during adipogenesis (Figure 5C). Finally, we used Targetscan to predict possible binding between miRNAs and RNA sequences, which showed that mir‐449a has a strong binding ability (8‐mer) with lncRNA‐Adi (Figure 5D).
To verify the binding relationship between lncRNA‐Adi and miR‐449a, we used the dual luciferase reporter assay. Wild‐type and mutant lncRNA‐Adi were fused to the luciferase coding region (F‐luc‐lncRNA‐Adi‐WT and F‐luc‐lncRNA‐Adi‐mut) and transfected into H293T cells with or without miR‐449a mimics. Luciferase assays showed that, in the presence of miR‐449a, wild‐type lncRNA‐Adi reporter constructs were significantly downregulated compared with mutant lncRNA‐Adi reporter constructs (Figure 5E). This indicated that lncRNA‐Adi binds miR‐449a and acts as an miR‐449a decoy.
3.5. LncRNA‐Adi interacts with miR‐449a to control CDK6‐pRb‐E2F1 axis in adipogenesis regulation
Mir‐449a is an important member of miR‐34 family, which has significant roles in regulating cell divisions. To verify whether the lncRNA‐Adi interacting with miR‐449a influences cell divisions during adipogenesis, we first examined the proliferation of BC, NC, and lnc‐Adi‐KD ADSCs. Lnc‐Adi‐KD proliferation was significantly downregulated compared with BC and NC groups on days 3, 5, and 7 after adipogenic induction, indicating that interfering with lncRNA‐Adi expression inhibited cell divisions during adipogenesis (Figure 6A). We next undertook ADSC cell cycle analysis on day 1 after adipogenic induction to determine which checkpoint was influenced. We found that lnc‐Adi‐KD ADSCs had a lower proportion of cells in S phase than BC groups (Figure 6B,C), in which the mean proportion of cells in S phase is 10.16% in BC group and 6.85% in lnc‐Adi‐KD group with statistical difference. And the mean proportion of cells in G1 phase is 77.37% in BC group and 78.17% in lnc‐Adi‐KD group and that of cells in G2 phase is 7.53% in BC group and 8.9% in lnc‐Adi‐KD group. We also evaluated the relative expression of miR‐449a in ADSCs, and found that it was downregulated in the MCE stage and gradually upregulated in the TD stage during the adipogenic induction of ADSCs (Figure 6D). These results indicated that lncRNA‐Adi influences cell division by controlling miR‐449a.
FIGURE 6.
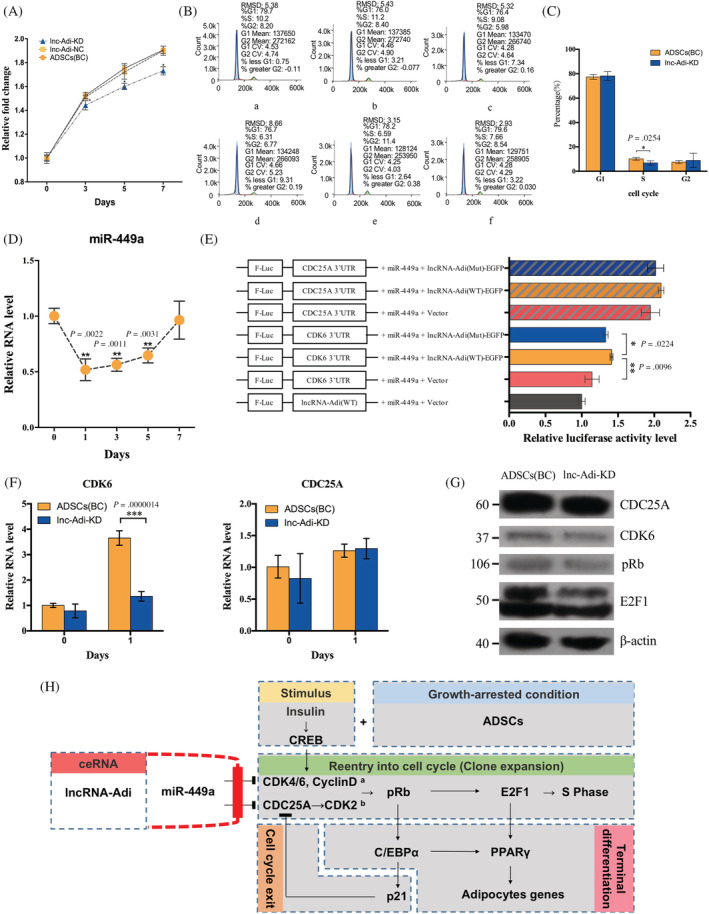
Long noncoding (lnc)RNA‐Adi controls miR‐449a to regulate the CDK6‐pRb‐E2F1 axis in the control of adipogenesis. A, Adipose tissue‐derived stromal cell (ADSC) proliferation rate in KD, NC, and KD groups during adipogenic induction; n = 3. B, ADSC cell cycle analysis on day 1 after adipogenic induction in BC (upper panel) and KD (lower panel) groups. C, Percentage of cells in G1, S, and G2 phases in BC and KD groups; n = 3. D, Expression pattern of miR‐449a in ADSCs during adipogenic induction; n = 3. E, Dual luciferase reporter assay verification of the impact of lncRNA‐Adi and miR‐449a interaction on CDK6 and CDC25A expression during adipogenic induction of ADSCs; n = 3. F, Relative expression of CDK6 and CDC25A in ADSCs with adipogenic induction for 0 and 1 days in BC and KD groups; n = 3. G, Western blot analysis of CDC25A, CDK6, pRb, and E2F1 in BC and KD groups. H, Integrated model explains the mechanism of lncRNA‐Adi in regulating adipogenesis
To further understand how the interaction of lncRNA‐Adi and miR‐449a regulates target mRNA during adipogenesis, we assumed that CDK6 and CDC25A mRNAs were the target mRNAs protected by lncRNA‐Adi from degradation by miR‐449a and tested this by the dual luciferase reporter assay.
To further find out the target mRNA regulating by the interaction of lncRNA‐Adi and miR‐449a during adipogenesis, we made a prediction based on previous studies. According to the previous studies, we assumed that miR‐449a target CDK6 and CDC25A mRNAs were the target mRNAs protected by lncRNA‐Adi from degradation by miR‐449a. In the presence of the wild‐type lncRNA‐Adi plasmid, the 3′ untranslated region (UTR) of CDK6 reporter constructs was upregulated even though miR‐449a was present, but the 3′ UTR of CDC25A was not influenced either in the presence of miR‐449a mimics or plasmids encoding wild‐type lncRNA‐Adi and miR‐449a mimics. These results showed that CDK6 mRNA could be prevented from degradation by miR‐449a in the presence of lncRNA‐Adi (Figure 6E).
Because CDK6 is an important inducer that dissociates the pRb/E2F1 complex into free pRb and E2F1, we next investigated whether lncRNA‐Adi could bind miR‐449a to prevent CDK6 mRNA degradation. CDK6 mRNA expression and the protein expression of CDK6, pRb, and E2F1 were downregulated in lnc‐Adi‐KD ADSCs at day 1 after adipogenic induction. This verified that lncRNA‐Adi influenced CDK6‐pRb‐E2F1 axis activation by binding with miR‐449a during adipogenesis (Figure 6F,G). All the P‐adjusted values for qPCR analyzes are showed in Table S4.
4. DISCUSSION
Since the first successful isolation of ADSCs from adipose tissue, 24 their adipogenic differentiation has been widely and systematically studied. 25 , 26 , 27 , 28 The primary stages of adipogenesis and various regulatory molecules such as PPARγ have previously been extensively reported. 29 , 30 , 31 However, it remains unclear which molecules regulate adipogenesis in its early clonal expansion stage, and what are the key factors that control miRNA regulation of target mRNA during adipogenesis. 32 , 33 , 34
To answer these questions, we focused on lncRNAs, which were recently shown to have important functions in cell differentiation. 35 Using full transcriptome microarrays, we identified lncRNA‐Adi as being highly expressed in adipogenic‐induced ADSCs compared with undifferentiated ADSCs. Further studies showed that lncRNA‐Adi was specifically and highly expressed in the MCE stage of adipogenesis. Knockdown of lncRNA‐Adi in ADSCs blocked adipogenic differentiation, illustrating that lncRNA‐Adi was indispensable for adipogenesis. We also found that lncRNA‐Adi was located in the cytoplasm and bound miR‐449a. This interaction was shown to influence CDK6‐pRb‐E2F1 axis activation to regulate cell division and PPARγ expression during adipogenesis. These results reveal the importance of lncRNA‐Adi in the regulatory networks of adipogenesis, and show that lncRNAs are potential targets against obesity and excess weight gain.
The concept that lncRNAs play important functions in biological processes has been widely embraced now. It was found owning important regulatory roles in many physiological functions like X chromosome inactivation and genomic imprinting and so on. 13 , 36 Also, abnormal lncRNA expression has been documented in diseases such as cancer and Alzheimer's disease, whereas lncRNAs have also been shown to have an important impact on cell differentiation and tissue development. 14 , 35 Besides, lncRNAs have been demonstrated owning tissue and cell‐specific expression profiles. It was found that lncRNAs strikingly tissue specifically expressed across different tissues and cell types. 37 Thus, lncRNAs are thought as fine‐tuners of cell fates and are worth further studies in kinds of biological processes. 38 , 39
Previous studies investigated the role of lncRNAs in controlling adipogenic differentiation. One hundred seventy‐five lncRNAs were shown to be specifically regulated during adipogenesis, although their functions remain to be clarified, whereas Blnc1 was reported to function in brown and beige adipocyte development. 20 , 40 Moreover, lncRNA ADINR controlled adipocyte differentiation by activating C/EBPα. 41 However, these studies did not focus on different stages of adipocyte differentiation. LncRNA‐Adi was first described and identified genome sequence of the Brown Norway rat, 21 whereas the function of lncRNA‐Adi on adipogenesis has not yet been illustrated. In the present study, we identified lncRNA‐Adi as having differential expression between adipogenic‐induced and uninduced ADSCs, as well as an important position in the regulatory network, specifically in the MCE stage of adipogenesis. And the functions of lncRNA‐Adi on adipogenic differentiation of mesenchymal stem cells from other source like bone marrow have not been reported, which could be a research agenda in further study.
MCE and TD are the two most crucial stages of adipogenesis. 30 , 42 Blocking TD would undoubtedly impair fat cell formation during adipogenesis, but the role of MCE was previously unclear. However, recent in vitro and in vivo studies have shown that blocking MCE impaired adipogenesis. 43 , 44 Moreover, several regulatory molecules such as SIRT6 and miR‐363 were found to regulate adipogenesis by influencing MCE. 12 , 45 However, the regulatory roles of MCE stage in adipogenesis have still not been elucidated, and no studies have reported the function of lncRNAs in MCE. We found that lncRNA‐Adi highly expressed in MCE stage and we conducted an RNAi‐mediated loss‐of‐function experiment, which showed that lncRNA‐Adi silencing in ADSCs impaired lipid droplet accumulation on the seventh day of adipogenic induction. It also repressed the expression of six key adipogenic genes, revealing suppression at the molecular level. These results confirmed that lncRNA‐Adi controls the process of adipogenic differentiation at the MCE stage.
The mechanisms by which lncRNAs regulate biological process are various and complex, and can be summarized as four archetypes: signals, decoys, guides, and scaffolds. 23 The exact mechanism depends on the lncRNA location. LncRNAs acting as signals, guides, and scaffolds are largely located in the nucleus, whereas those functioning as decoys could be located either in the nucleus or in the cytoplasm. FISH and nuclear‐ and cytoplasmic‐fractionated qRT‐PCR both indicated that lncRNA‐Adi was located in the cytoplasm, suggesting that it is likely to function as a decoy. Targetscan and Miranda software both predicted an interaction between lncRNA‐Adi and mir‐449a, which was confirmed by the dual luciferase reporter assay. This showed that lncRNA‐Adi acts as an miR‐449a decoy to regulate the adipogenic differentiation of ADSCs.
MiR‐449a has an important role in regulating cell cycle arrest. 46 , 47 It influences the pRb‐E2F1 pathway in cell proliferation by controlling CDK6 and CDC25A. 48 , 49 E2F1 is a key transcriptional factor in MCE stage and it also controls the expression of PPARγ in the TD stage of adipogenesis, which decided that E2F1 could play dual functions in adipogenesis. 50 , 51 In the present study, repressing the expression of lncRNA‐Adi reduced the expression of CDK6 and inhibited the pRb‐E2F1 pathway. This indicated that lncRNA‐Adi interacts with miR‐449a to upregulate the CDK6‐pRb‐E2F1 axis, promote cell proliferation during MCE, and influence PPARγ expression in the TD stage of ADSC adipogenic differentiation. This also explains why lncRNA‐Adi was highly expressed during the entire process of adipogenesis but demonstrated different expression levels between MCE and TD, suggesting that the dual function of E2F1 in adipogenesis might be controlled by lncRNA‐Adi.
5. CONCLUSION
In summary, lncRNA‐Adi was specifically and highly expressed in the MCE stage of ADSC adipogenic differentiation, and inhibition of its expression blocked adipogenic differentiation. Our findings suggest that lncRNA‐Adi could be a ceRNA to CDK6, both of which interact with miR‐449a, to control the pRb‐E2F1 pathway in the adipogenic differentiation of ADSCs. This could form the basis of future work to treat obesity and other metabolic diseases.
CONFLICT OF INTEREST
The authors declared no potential conflicts of interest.
AUTHOR CONTRIBUTIONS
Y.C., K.L.: data analysis and interpretation, manuscript writing, review, and revision of the manuscript; X.Z.: data analysis and interpretation, cell preparation; J.C.: manuscript editing, study supervision; M.L.: collection and/or assembly of data; L.L.: conception and design, review, and revision of the manuscript, administrative support, financial support, provision of study material, final approval of manuscript.
Supporting information
Appendix S1. Supporting Information.
Figure S1 Gene ontology analysis showed the enriched functions of the upregulated and downregulated mRNAs in adipogenic‐induced ADSCs.
Figure S2 KEGG pathway analysis showed the enriched pathways of the upregulated(A) and downregulated(B) mRNAs in adipogenic‐induced ADSCs.
Figure S3 The signal net. Red circle nodes denote upregulated mRNAs and blue circle nodes denote downregulated mRNAs.
Figure S4 lncRNA‐mRNA networks in undifferentiated ADSCs (A) and adipogenic‐induced ADSCs (B). Circle nodes denote mRNAs and circle nodes with border denote lcnRNAs and red color denotes upregulated mRNAs or lncRNAs and blue color denotes downregulated mRNAs or lncRNAs.
Figure S5 TF‐lncRNA‐mRNA network. Triangle denote transcription factors and circle nodes denote mRNAs and circle nodes with border denote lcnRNAs.
Table S2 P‐adjusted values for microarray
Table S3 P‐adjusted values for Go analyzes.
Table S4 P‐adjusted values for qPCR analyzes.
ACKNOWLEDGMENT
This work was supported by grants from the National Natural Science Foundation of China (NSFC) (81670951, 81800962).
Chen Y, Li K, Zhang X, Chen J, Li M, Liu L. The novel long noncoding RNA lncRNA‐Adi regulates adipogenesis. STEM CELLS Transl Med. 2020;9:1053–1067. 10.1002/sctm.19-0438
Yuanwei Chen and Kaide Li contributed equally to this study.
Funding information National Natural Science Foundation of China, Grant/Award Numbers: 81800962, 81670951
DATA AVAILABILITY STATEMENT
Data Availability Statement The data that support the findings of this study are available from the corresponding author upon reasonable request.
REFERENCES
- 1. Flegal KM, Kruszon‐Moran D, Carroll MD, Fryar CD, Ogden CL. Trends in obesity among adults in the United States, 2005 to 2014. Jama. 2016;315(21):2284‐2291. [DOI] [PMC free article] [PubMed] [Google Scholar]
- 2. NCD Risk Factor Collaboration (NCD‐RisC) . Worldwide trends in body‐mass index, underweight, overweight, and obesity from 1975 to 2016: a pooled analysis of 2416 population‐based measurement studies in 128·9 million children, adolescents, and adults. Lancet. 2017;390(10113):2627‐2642. [DOI] [PMC free article] [PubMed] [Google Scholar]
- 3. Kelly T, Yang W, Chen C‐S, Reynolds K, He J. Global burden of obesity in 2005 and projections to 2030. Int J Obes (Lond). 2008;32(9):1431‐1437. [DOI] [PubMed] [Google Scholar]
- 4. Bhupathiraju SN, Hu FB. Epidemiology of obesity and diabetes and their cardiovascular complications. Circ Res. 2016;118(11):1723‐1735. [DOI] [PMC free article] [PubMed] [Google Scholar]
- 5. Moreno‐Navarrete JM, Fernández‐Real JM. Adipocyte differentiation Adipose Tissue Biology. Springer, Cham; 2017:69‐90. [Google Scholar]
- 6. Sun K, Kusminski CM, Scherer PE. Adipose tissue remodeling and obesity. J Clin Invest. 2011;121(6):2094‐2101. [DOI] [PMC free article] [PubMed] [Google Scholar]
- 7. Lefterova MI, Lazar MA. New developments in adipogenesis. Trends Endocrinol Metab. 2009;20(3):107‐114. [DOI] [PubMed] [Google Scholar]
- 8. Rosen ED, Spiegelman BM. What we talk about when we talk about fat. Cell. 2014;156(1):20‐44. [DOI] [PMC free article] [PubMed] [Google Scholar]
- 9. Keats EC, Dominguez JM, Grant MB, et al. Switch from canonical to noncanonical Wnt signaling mediates high glucose‐induced adipogenesis. Stem Cells. 2014;32(6):1649‐1660. [DOI] [PMC free article] [PubMed] [Google Scholar]
- 10. Macdougall CE, Wood EG, Loschko J, et al. Visceral adipose tissue immune homeostasis is regulated by the crosstalk between adipocytes and dendritic cell subsets. Cell Metab. 2018;27(3):588‐601.e4. [DOI] [PMC free article] [PubMed] [Google Scholar]
- 11. Hu L, Yang G, Hägg D, et al. IGF1 promotes adipogenesis by a lineage bias of endogenous adipose stem/progenitor cells. Stem Cells. 2015;33(8):2483‐2495. [DOI] [PMC free article] [PubMed] [Google Scholar]
- 12. Chen L, Cui J, Hou J, Long J, Li C, Liu L. A novel negative regulator of adipogenesis: microRNA‐363. Stem Cells. 2014;32(2):510‐520. [DOI] [PubMed] [Google Scholar]
- 13. Quinn JJ, Chang HY. Unique features of long non‐coding RNA biogenesis and function. Nat Rev Genet. 2016;17(1):47‐62. [DOI] [PubMed] [Google Scholar]
- 14. Batista PJ, Chang HY. Long noncoding RNAs: cellular address codes in development and disease. Cell. 2013;152(6):1298‐1307. [DOI] [PMC free article] [PubMed] [Google Scholar]
- 15. Cesana M, Cacchiarelli D, Legnini I, et al. A long noncoding RNA controls muscle differentiation by functioning as a competing endogenous RNA. Cell. 2011;147(2):358‐369. [DOI] [PMC free article] [PubMed] [Google Scholar]
- 16. Klattenhoff CA, Scheuermann JC, Surface LE, et al. Braveheart, a long noncoding RNA required for cardiovascular lineage commitment. Cell. 2013;152(3):570‐583. [DOI] [PMC free article] [PubMed] [Google Scholar]
- 17. Wang P, Xue Y, Han Y, et al. The STAT3‐binding long noncoding RNA lnc‐DC controls human dendritic cell differentiation. Science. 2014;344(6181):310‐313. [DOI] [PubMed] [Google Scholar]
- 18. Zhu E, Zhang J, Li Y, Yuan H, Zhou J, Wang B. Long noncoding RNA Plnc1 controls adipocyte differentiation by regulating peroxisome proliferator–activated receptor γ. FASEB J. 2019;33(2):2396‐2408. [DOI] [PubMed] [Google Scholar]
- 19. Li M, Xie Z, Wang P, et al. The long noncoding RNA GAS5 negatively regulates the adipogenic differentiation of MSCs by modulating the miR‐18a/CTGF axis as a ceRNA. Cell Death Dis. 2018;9(5):1‐13. [DOI] [PMC free article] [PubMed] [Google Scholar]
- 20. Sun L, Goff LA, Trapnell C, et al. Long noncoding RNAs regulate adipogenesis. Proc Natl Acad Sci USA. 2013;110(9):3387‐3392. [DOI] [PMC free article] [PubMed] [Google Scholar]
- 21. Gibbs RA, Weinstock GM, Metzker ML, et al. Genome sequence of the Brown Norway rat yields insights into mammalian evolution[J]. Nature. 2004;428(6982):493‐520. [DOI] [PubMed] [Google Scholar]
- 22. Bourin P, Bunnell BA, Casteilla L, et al. Stromal cells from the adipose tissue‐derived stromal vascular fraction and culture expanded adipose tissue‐derived stromal/stem cells: a joint statement of the International Federation for Adipose Therapeutics and Science (IFATS) and the International Society for Cellular Therapy (ISCT). Cytotherapy. 2013;15(6):641‐648. [DOI] [PMC free article] [PubMed] [Google Scholar]
- 23. Wang KC, Chang HY. Molecular mechanisms of long noncoding RNAs. Mol Cell. 2011;43(6):904‐914. [DOI] [PMC free article] [PubMed] [Google Scholar]
- 24. Zuk PA, Zhu M, Mizuno H, et al. Multilineage cells from human adipose tissue: implications for cell‐based therapies. Tissue Eng. 2001;7(2):211‐228. [DOI] [PubMed] [Google Scholar]
- 25. Lee J‐M, Govindarajah V, Goddard B, et al. Obesity alters the long‐term fitness of the hematopoietic stem cell compartment through modulation of Gfi1 expression. J Exp Med. 2018;215(2):627‐644. [DOI] [PMC free article] [PubMed] [Google Scholar]
- 26. Malle EK, Zammit NW, Walters SN, et al. Nuclear factor κB–inducing kinase activation as a mechanism of pancreatic β cell failure in obesity. J Exp Med. 2015;212(8):1239‐1254. [DOI] [PMC free article] [PubMed] [Google Scholar]
- 27. Xie Y, Wang X, Wu X, et al. Lysophosphatidic acid receptor 4 regulates osteogenic and adipogenic differentiation of progenitor cells via inactivation of RhoA/ROCK1/β‐catenin signaling. Stem Cells. 2019;38(3):1‐13. [DOI] [PubMed] [Google Scholar]
- 28. De Sousa M, Porras DP, Perry CG, et al. p107 is a crucial regulator for determining the adipocyte lineage fate choices of stem cells. Stem Cells. 2014;32(5):1323‐1336. [DOI] [PubMed] [Google Scholar]
- 29. Lefterova MI, Haakonsson AK, Lazar MA, Mandrup S. PPARγ and the global map of adipogenesis and beyond. Trends Endocrinol Metab. 2014;25(6):293‐302. [DOI] [PMC free article] [PubMed] [Google Scholar]
- 30. Tang QQ, Lane MD. Adipogenesis: from stem cell to adipocyte. Annu Rev Biochem. 2012;81:715‐736. [DOI] [PubMed] [Google Scholar]
- 31. Kazak L, Chouchani ET, Lu GZ, et al. Genetic depletion of adipocyte creatine metabolism inhibits diet‐induced thermogenesis and drives obesity. Cell Metab. 2017;26(4):660‐71.e3. [DOI] [PMC free article] [PubMed] [Google Scholar]
- 32. Ali AT, Hochfeld WE, Myburgh R, Pepper MS. Adipocyte and adipogenesis. Eur J Cell Biol. 2013;92(6):229‐236. [DOI] [PubMed] [Google Scholar]
- 33. Hilton C, Neville MJ, Karpe F. MicroRNAs in adipose tissue: their role in adipogenesis and obesity. Int J Obes (Lond). 2013;37(3):325‐332. [DOI] [PubMed] [Google Scholar]
- 34. Denzler R, Agarwal V, Stefano J, Bartel DP, Stoffel M. Assessing the ceRNA hypothesis with quantitative measurements of miRNA and target abundance. Mol Cell. 2014;54(5):766‐776. [DOI] [PMC free article] [PubMed] [Google Scholar]
- 35. Fatica A, Bozzoni I. Long non‐coding RNAs: new players in cell differentiation and development. Nat Rev Genet. 2014;15(1):7‐21. [DOI] [PubMed] [Google Scholar]
- 36. Rinn JL, Chang HY. Genome regulation by long noncoding RNAs. Annu Rev Biochem. 2012;81:145‐166. [DOI] [PMC free article] [PubMed] [Google Scholar]
- 37. Cabili MN, Trapnell C, Goff L, et al. Integrative annotation of human large intergenic noncoding RNAs reveals global properties and specific subclasses. Genes Dev. 2011;25(18):1915‐1927. [DOI] [PMC free article] [PubMed] [Google Scholar]
- 38. Derrien T, Johnson R, Bussotti G, et al. The GENCODE v7 catalog of human long noncoding RNAs: analysis of their gene structure, evolution, and expression. Genome Res. 2012;22(9):1775‐1789. [DOI] [PMC free article] [PubMed] [Google Scholar]
- 39. Lee JT. Epigenetic regulation by Long noncoding RNAs. Science. 2012;338(6113):1435‐1439. [DOI] [PubMed] [Google Scholar]
- 40. Zhao X‐Y, Li S, Wang G‐X, Yu Q, Lin JD. A Long noncoding RNA transcriptional regulatory circuit drives thermogenic adipocyte differentiation. Mol Cell. 2014;55(3):372‐382. [DOI] [PMC free article] [PubMed] [Google Scholar]
- 41. Xiao T, Liu L, Li H, et al. Long noncoding RNA ADINR regulates adipogenesis by transcriptionally activating C/EBPα. Stem Cell Rep. 2015;5(5):856‐865. [DOI] [PMC free article] [PubMed] [Google Scholar]
- 42. Poulos SP, Dodson MV, Hausman GJ. Cell line models for differentiation: preadipocytes and adipocytes. Exp Biol Med (Maywood). 2010;235(10):1185‐1193. [DOI] [PubMed] [Google Scholar]
- 43. Merkestein M, Laber S, McMurray F, et al. FTO influences adipogenesis by regulating mitotic clonal expansion. Nat Commun. 2015;6:6792. [DOI] [PMC free article] [PubMed] [Google Scholar]
- 44. Tang Q‐Q, Otto TC, Lane MD. Mitotic clonal expansion: a synchronous process required for adipogenesis. Proc Natl Acad Sci. 2003;100(1):44‐49. [DOI] [PMC free article] [PubMed] [Google Scholar]
- 45. Chen Q, Hao W, Xiao C, et al. SIRT6 is essential for adipocyte differentiation by regulating mitotic clonal expansion. Cell Rep. 2017;18(13):3155‐3166. [DOI] [PMC free article] [PubMed] [Google Scholar]
- 46. Lizé M, Klimke A, Dobbelstein M. MicroRNA‐449 in cell fate determination. Cell Cycle. 2011;10(17):2874‐2882. [DOI] [PubMed] [Google Scholar]
- 47. Rokavec M, Li H, Jiang L, Hermeking H. The p53/miR‐34 axis in development and disease. J Mol Cell Biol. 2014;6(3):214‐230. [DOI] [PubMed] [Google Scholar]
- 48. Feng M, Yu Q. miR‐449 regulates CDK‐Rb‐E2F1 through an auto‐regulatory feedback circuit. Cell Cycle. 2010;9(2):213‐214. [DOI] [PubMed] [Google Scholar]
- 49. Ye W, Xue J, Zhang Q, et al. MiR‐449a functions as a tumor suppressor in endometrial cancer by targeting CDC25A. Oncol Rep. 2014;32(3):1193‐1199. [DOI] [PubMed] [Google Scholar]
- 50. Fajas L, Landsberg RL, Huss‐Garcia Y, Sardet C, Lees JA, Auwerx J. E2Fs regulate adipocyte differentiation. Dev Cell. 2002;3(1):39‐49. [DOI] [PubMed] [Google Scholar]
- 51. Denechaud PD, Fajas L, Giralt A. E2F1, a novel regulator of metabolism. Front Endocrinol. 2017;8:311. [DOI] [PMC free article] [PubMed] [Google Scholar]
Associated Data
This section collects any data citations, data availability statements, or supplementary materials included in this article.
Supplementary Materials
Appendix S1. Supporting Information.
Figure S1 Gene ontology analysis showed the enriched functions of the upregulated and downregulated mRNAs in adipogenic‐induced ADSCs.
Figure S2 KEGG pathway analysis showed the enriched pathways of the upregulated(A) and downregulated(B) mRNAs in adipogenic‐induced ADSCs.
Figure S3 The signal net. Red circle nodes denote upregulated mRNAs and blue circle nodes denote downregulated mRNAs.
Figure S4 lncRNA‐mRNA networks in undifferentiated ADSCs (A) and adipogenic‐induced ADSCs (B). Circle nodes denote mRNAs and circle nodes with border denote lcnRNAs and red color denotes upregulated mRNAs or lncRNAs and blue color denotes downregulated mRNAs or lncRNAs.
Figure S5 TF‐lncRNA‐mRNA network. Triangle denote transcription factors and circle nodes denote mRNAs and circle nodes with border denote lcnRNAs.
Table S2 P‐adjusted values for microarray
Table S3 P‐adjusted values for Go analyzes.
Table S4 P‐adjusted values for qPCR analyzes.
Data Availability Statement
The raw microarray data have been deposited in the Gene Expression Omnibus database (accession code GSE119796). All microarray experiments were performed as independent triplicates, and the microarray data referenced during the study are available in a public repository (https://www.ncbi.nlm.nih.gov/geo/).
Data Availability Statement The data that support the findings of this study are available from the corresponding author upon reasonable request.