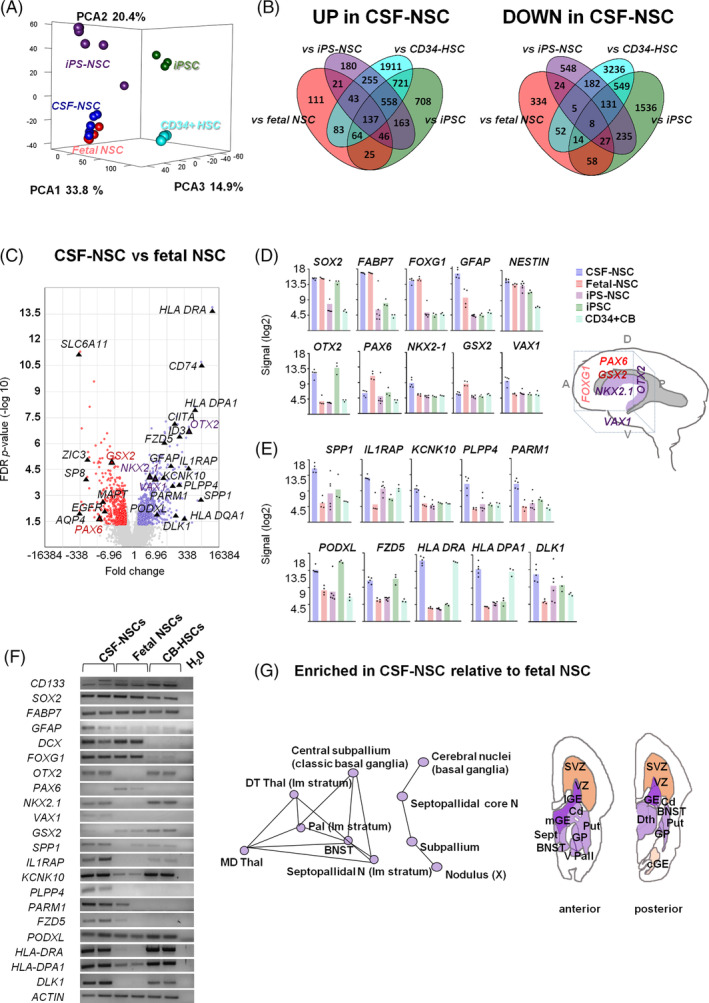
FIGURE 3.

NSC cells isolated from the CSF display a ventral forebrain gene‐expression profile. A, PCA analysis of global gene‐expression profiles. B, Venn diagrams showing the number of differentially expressed genes (DEG), 2‐fold change, FDR P < .05. C, Volcano plot of DEG in NSCs from fetal brain (red) and CSF (blue) sources. Highlighted are markers that identify regional populations including genes that have been previously associated with germinal zones and forebrain regionalization (see also schematic in D) and putative candidates for prospective identification of germinal zone NSCs. Expression levels of NSC and regional forebrain markers (D) and candidate DEG genes that could identify this NSC population (E). F, Semi‐quantitative RT‐PCR of NSC markers and candidate DEG genes. G, Enrichment network analysis of upregulated genes relative to fetal NSCs, profiled across brain regions according to the Allen brain atlas, and schematic neuroanatomical representation on coronal brain sections showing their periventricular location. A, anterior; BNST, bed nuclei of the stria terminalis; cGE, caudal ganglionic eminence; Cd, caudate nucleus; D, dorsal; DThal, dorsal thalamus; GP, globus pallidus; lGE, lateral ganglionic eminence; mGE, medial ganglionic eminence; P, posterior; Put, putamen; Sept, septum; SVZ, subventricular zone; Thal, thalamus; V, ventral; V Pall, ventral pallidum; VZ, ventricular zone
