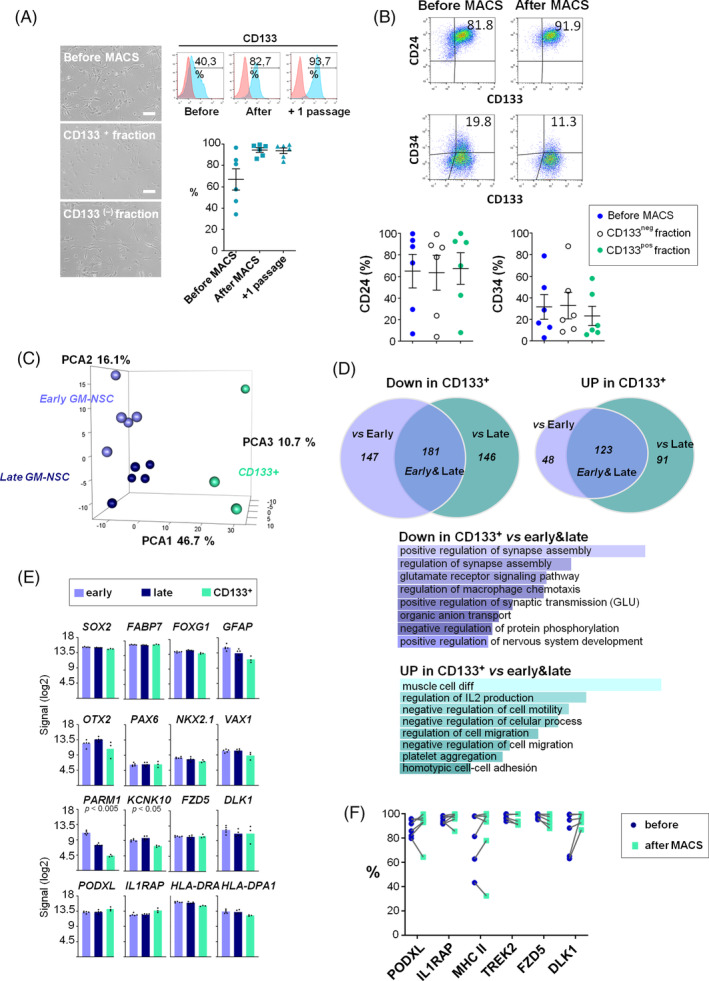
FIGURE 5.

Gz‐NSC signature is maintained after CD133 sorting. A, Cell morphology and flow cytometry of CD133 after MACS purification. Results are the mean of 6 independent biological replicates. Scale bar: 100 μm. B, Flow cytometry analysis of CD24 and CD34 before and after purification for CD133. Percentages of CD24+ and CD34+ before sorting (blue) and in both the CD133 negative (white) and CD133 positive (green) fractions showed no significant differences. Data are shown as mean ± SEM of 6 independent biological samples. C, PCA analysis of early, late, and sorted Gz‐NSC populations. D, Venn diagrams representing the transcriptional changes related to cell propagation (early vs late) and CD133 sorting (2‐fold change, R‐ANOVA FDR F < 0.05). There were no DEG between early and late passages. Genes downregulated in the CD133 sorted cells with respect to early and late passages corresponded to GO pathways related to neuronal and synaptic activity while those upregulated in the sorted cells were indicative of a less differentiated stage. E, Expression of NSCs, regional and Gz‐NSC markers at the RNA level in early, late, and CD133+ purified cells. F, Flow cytometry analysis of PODXL, IL1RAP, MHC II, TREK2, FZD5, and DLK1 expression before and after MACS purification. Data are shown as mean ± SEM of 6 independent biological samples
