FIGURE 6.

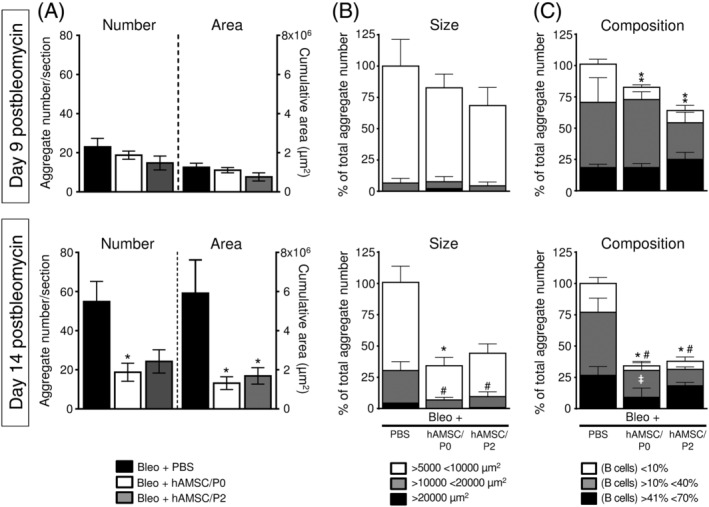
Human amniotic mesenchymal stromal cells (hAMSCs) compromise the formation and expansion of bleomycin‐induced lymphoid aggregates. Bleomycin instillation induced the formation of lymphoid aggregates in lung tissue. The number and the cumulative area of aggregates increased from days 9 to 14 postbleomycin (A). hAMSC treatment inhibited the formation of new aggregates and blocked their expansion, indeed the number and the cumulative areas of aggregates in hAMSC‐treated mice were stable from days 9 to 14 (A). In control mice (Bleo+PBS), at day 9 postbleomycin most of the single aggregates had a size ranging from 5000 to 10 000 μm2; at day 14 their size increased and aggregates with an intermediate (from 10 000 to 20 000 μm2) and large size (more than 20 000 μm2) developed/appeared (B). hAMSC treatment almost abolished the expansion of single aggregates, indeed a lower number of small and intermediate aggregates and very few large aggregate were detected (B; Bleo+hAMSC/P0 and Bleo+hAMSC/P2 groups). Control mice (Bleo+PBS) had lymphoid aggregates composed of T and B lymphocytes in variable proportions (C). At days 9 and 14, lymphoid aggregates with an intermediate presence of B cells (10%‐40% with respect to the total lymphoid population), represented approximately 75% of the total aggregates (C, gray bars). Between days 9 and 14, the aggregates with a higher presence of B cells (from 41% to 70%) increased (C, black bars). hAMSC treatment prevented the enrichment in B cells in lung lymphoid aggregates (C; Bleo+hAMSC/P0 and Bleo+hAMSC/P2 groups). Data are reported as mean ± SE of n = 4 (for control and treated groups at day 9) and n = 5 (for control and treated groups at day 14). A, *P < .05 compared to control (Bleo+PBS) group. B, *P < .05 by comparing number of aggregates with small size (>5000 <10 000 μm2) between control (Bleo+PBS) group and treated groups (Bleo+hAMSC/P0 and Bleo+hAMSC/P2). #P < .05 by comparing number of aggregates with intermediate size (>10 000 <20 000 μm2). C, *P < .05, **P < .01 by comparing number of aggregates with low presence of B cells (<10 %) between control (Bleo+PBS) group and treated groups (Bleo+hAMSC/P0 and Bleo+hAMSC/P2). #P < .05 by comparing number of aggregates with intermediate presence of B cells (>10% <40%). ‡P < .05 by comparing number of aggregates with large presence of B cells (>41% <70%)
