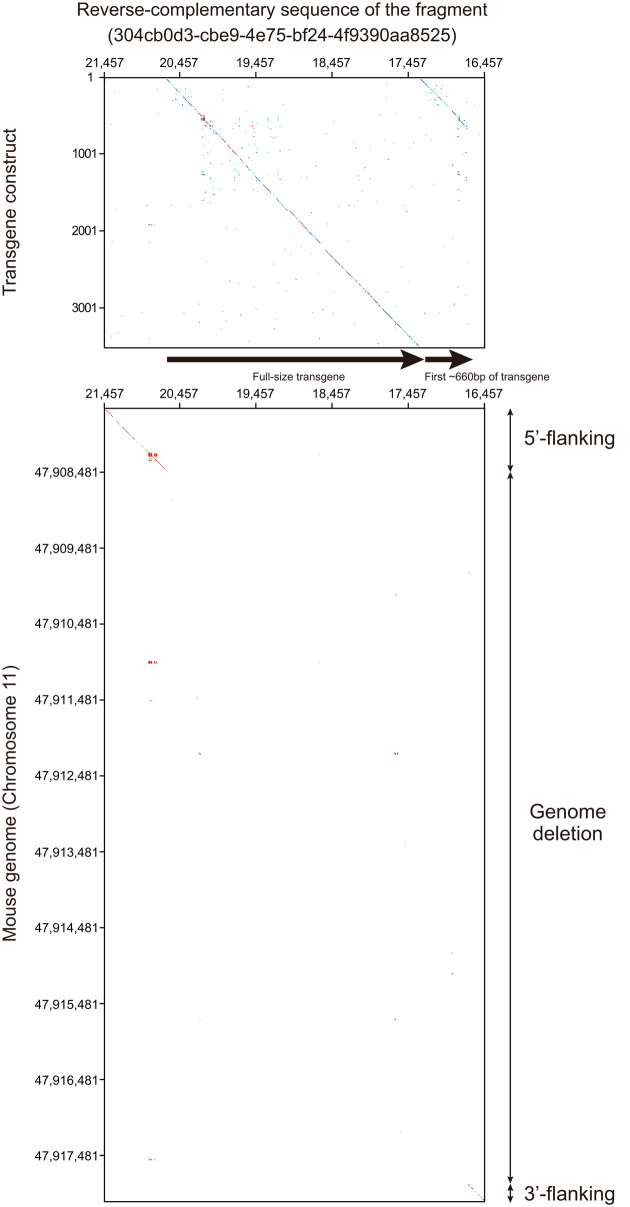
Fig. 3.
Nucleotide dot plot analysis. Nucleotide dot plots of DNA sequences of transgene construct (LC495729) and mouse reference genome against the reverse complementary sequence of the fragment (304cb0d3-cbe9-4e75-bf24-4f9390aa8525) hit by the local BLAST search (Fig. 2) are shown in the upper and lower panels, respectively. The upper panel reveals that the tandem concatenation of a whole transgene and the first ~660 bp of the transgene was integrated in the 4C30 genome. The lower panel indicates that the ~10 kilobases of the genome sequence was deleted between 5’- and 3’-flanking regions of the transgene insertion site.

