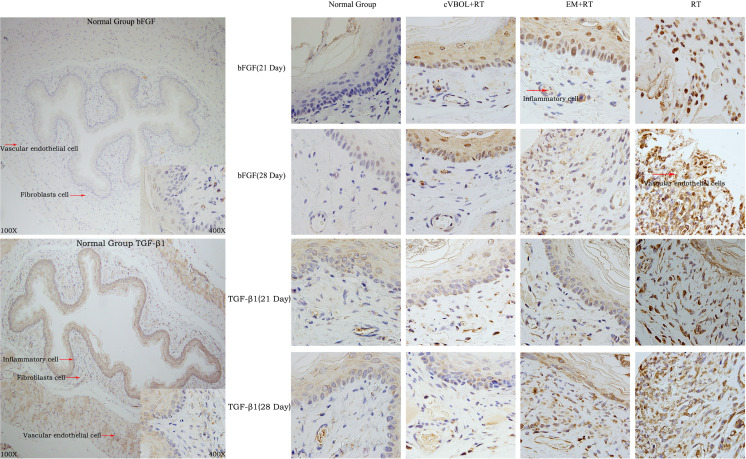
Fig. 2.
Immunohistochemistry results of the expression of bFGF and TGF-β1 in esophageal tissues of rats in each group. (A) Esophageal tissue of rat in the normal group (×400). (B) Esophageal tissue of rat in treatment group (cVBOL+RT, ×400). (C) Esophageal tissue of rat in the control group (EM+RT, ×400). (D) Esophageal tissue of rat in the model group (RT×400).

