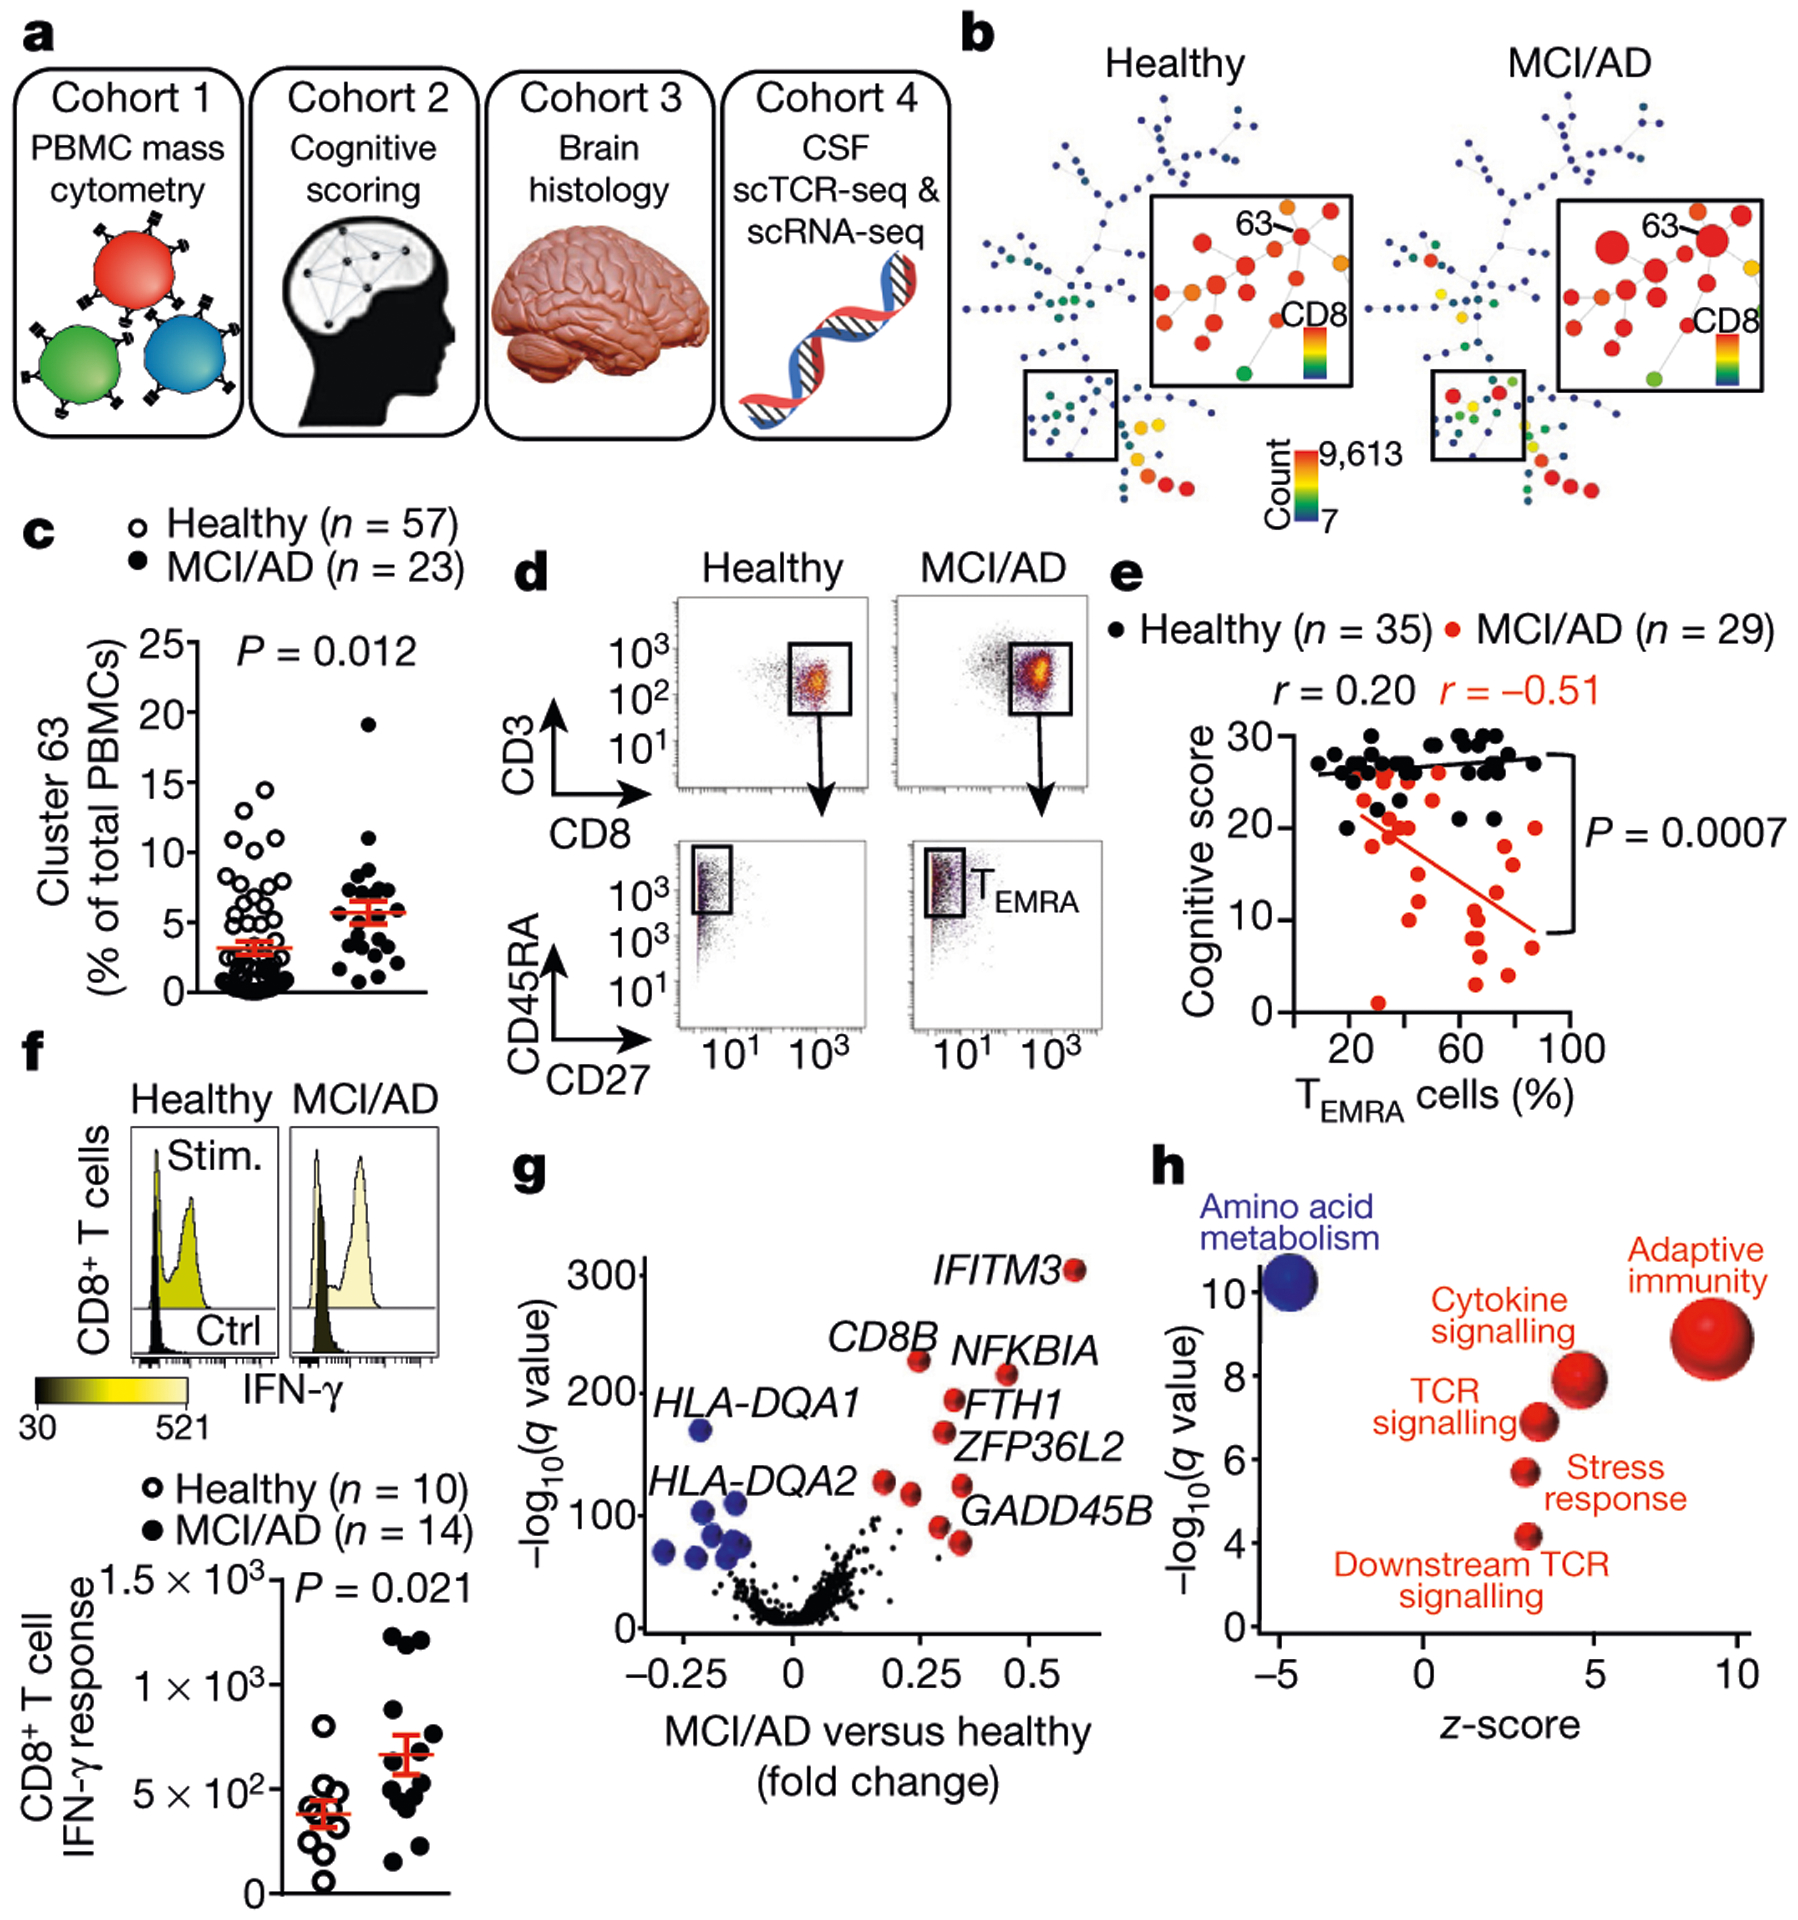
Fig. 1 |. Peripheral CD8+ TEMRA cells are increased in AD and are negatively associated with cognition.

a, Four cohorts were used to assess adaptive immunity in AD. b, Representative SPADE trees of PBMCs from healthy individuals and patients with MCI or AD in cohort 1 show an increased abundance of a CD8+ cluster (cluster 63) in patients with MCI or AD. Background tree nodes are sized according to cell counts. Insets are coloured according to CD8 expression. c, Quantification of cluster 63 as a percentage of total PBMCs. The percentage of cluster 63 cells is significantly higher in patients with MCI or AD than healthy control individuals. Mean ± s.e.m.; unpaired two-sided t-test with Welch’s correction. d, Marker expression analysis of cluster 63 corresponds to a CD3+CD8+CD45RA+CD27− TEMRA population. Data in c, d were pooled from seven independent experiments with similar results. e, Linear regression showing the inverse correlation between cognitive score and the percentage of CD8+ TEMRA cells in individuals from cohort 2. Pearson’s correlation r values are shown for each group. The significance of the difference between the two data sets was measured by ANCOVA. f, Stimulation with PMA and ionomycin (stim.) induces increased expression of IFN-γ in CD8+ T cells from patients with MCI or AD. Mean ± s.e.m.; unpaired two-sided t-test with Welch’s correction. g, Differential expression analysis (scRNA-seq) of CD8+ Temra cells from healthy individuals (n = 7) and patients with MCI or AD (n = 6) shows upregulated TCR signalling. Model-based analysis of single-cell transcriptomics (MAST) differential expression test with Benjamini-Hochberg correction. h, Pathway analysis of differentially expressed genes in CD8+ TEMRA cells from patients with MCI or AD (n = 6 subjects) versus healthy individuals (n = 7 subjects) shows increased antigenic stimulation of CD8+ TEMRA cells in patients with MCI or AD. Fisher’s exact test with Benjamini-Hochberg correction. Pathways (circles) with positive z-scores are coloured red; those with negative z-scores are coloured blue. The size of the circle corresponds to the size of the z -score (two-sided).
