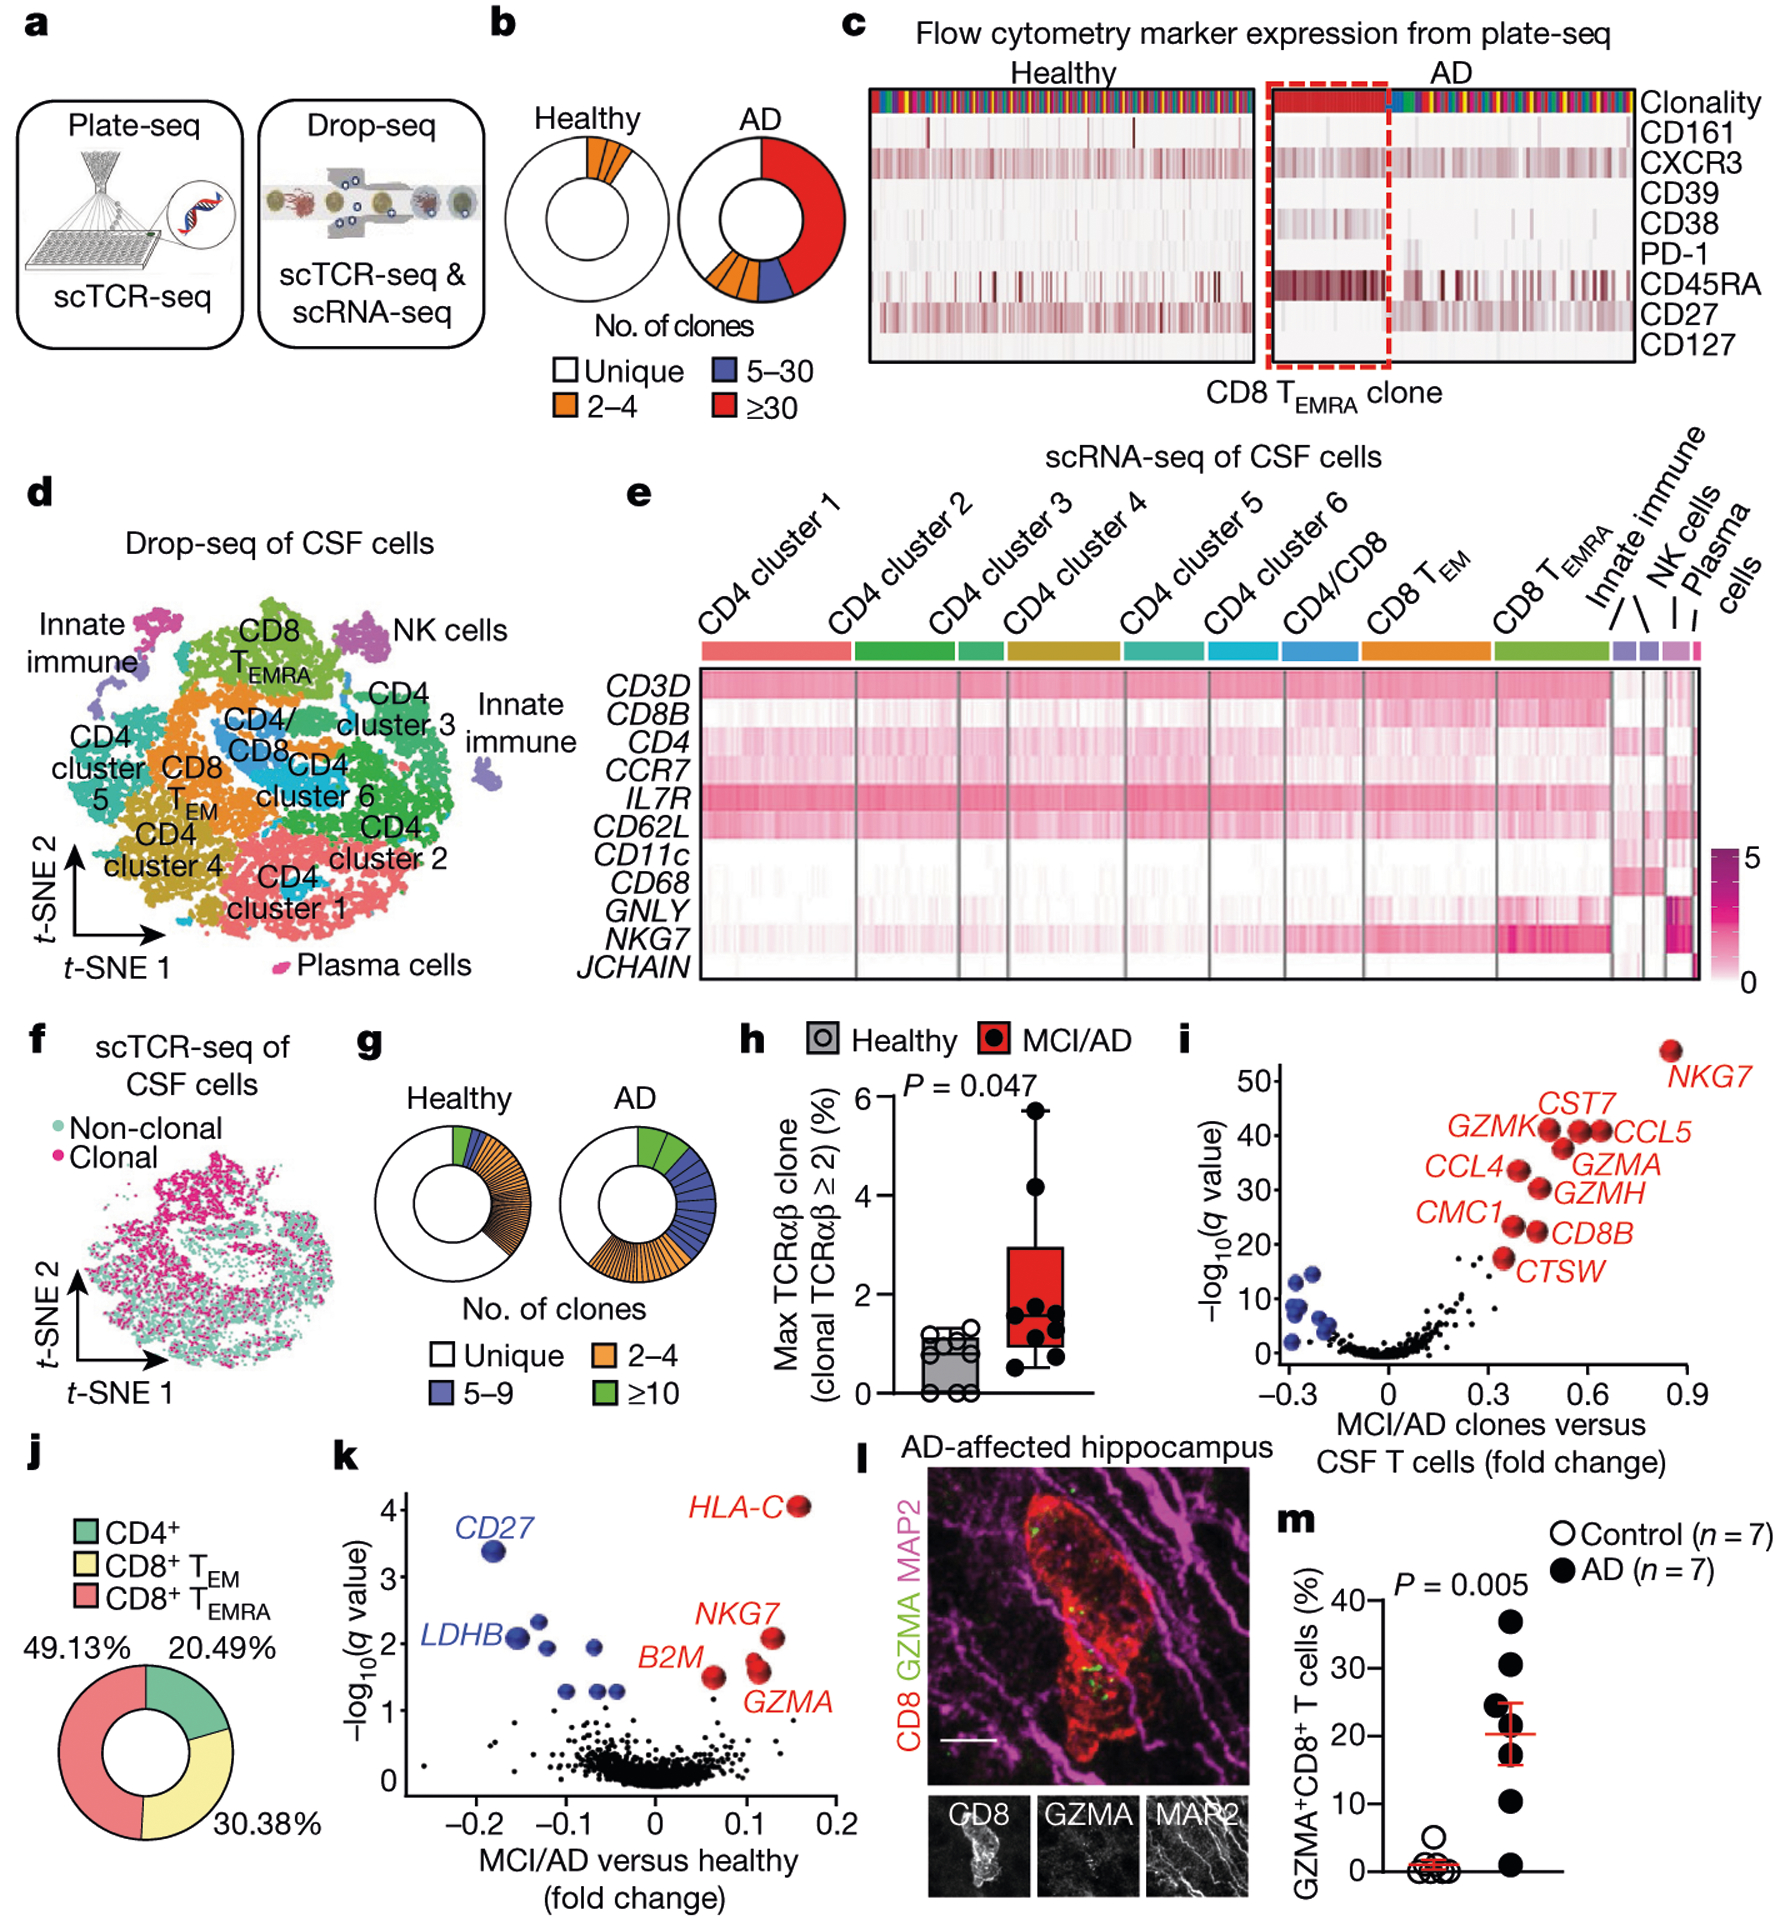
Fig. 3 |. Clonal expansion of CD8+ TEMRA cells in the CSF of patients with AD.

a, Plate-seq and drop-seq methods used for scTCR-seq and scRNA-seq of immune cells of the CSF in patients from cohort 4. b, CD8+ TCRαβ clonality (plate-seq) in the CSF of patients with AD and healthy control individuals. c, The top (most expanded) clone in AD had a marker expression profile of CD8+CD45RA+CD27− TEMRA cells. Data were replicated in two independent experiments. d, CSF cells analysed by drop-seq and clustered by multidimensional reduction with t-SNE, showing populations of immune cells that include CD8+ TEMRA cells (n = 9 healthy control individuals (10,876 cells); n = 9 patients with MCI or AD (10,391 cells)). e, Marker expression of CSF clusters, including CD8+ TEMRA cells. CD62L is also known as SELL; CD11c is also known as ITGAX. Data were pooled from three independent experiments. f, Concentration of clonal cells in locations of CD8+ T cell clusters (n = 9 subjects per group). g, Representative plots of CD8+ TCRαβ clonality (drop-seq) in age-matched subjects shows enhanced clonal expansion and more highly expanded clones in AD. Clones are coloured by proportion of the total TCRαβ sequences. h, Quantification of maximum clones (% TCRαβ sequences) shows a higher percentage in patients with MCI or AD than healthy control individuals (n = 9 subjects per group). Samples lacking clonal cells were scored as zero. Box plots show median and 25th to 75th percentiles, and whiskers indicate the minimum and maximum values. Unpaired two-sided f-test with Welch’s correction. i, Differential expression of highly expanded clones (clonal TCRαβ > 5) revealed increased expression of cytotoxic effector genes. MAST differential expression test with Benjamini-Hochberg correction (n = 9 patients with MCI or AD). j , Quantification of highly expanded clones (clonal TCRαβ > 5) showed that 49.13% of them are CD8+ TEMRA cells (n = 9 patients with MCI or AD). k, Increased expression of B2M, NKG7and GZMA in clonal CD8+ T cells from patients with MCI or AD. MAST differential expression test with Benjamini-Hochberg correction (n = 9 subjects/group). l, A hippocampal CD8+ T cell in an AD-affected brain (cohort 3) shows expression of GZMA adjacent to MAP2+ neuronal processes. Scale bar, 5 pm. Data were replicated in three independent experiments. m, Percentages of CD8+ T cells that express GZMA in control and AD-affected hippocampi. Mean ± s.e.m.; unpaired two-sided t-test with Welch’s correction.
