
Fig. 4 |. Antigen identification of clonally expanded TCRs in the CSF of patients with AD.
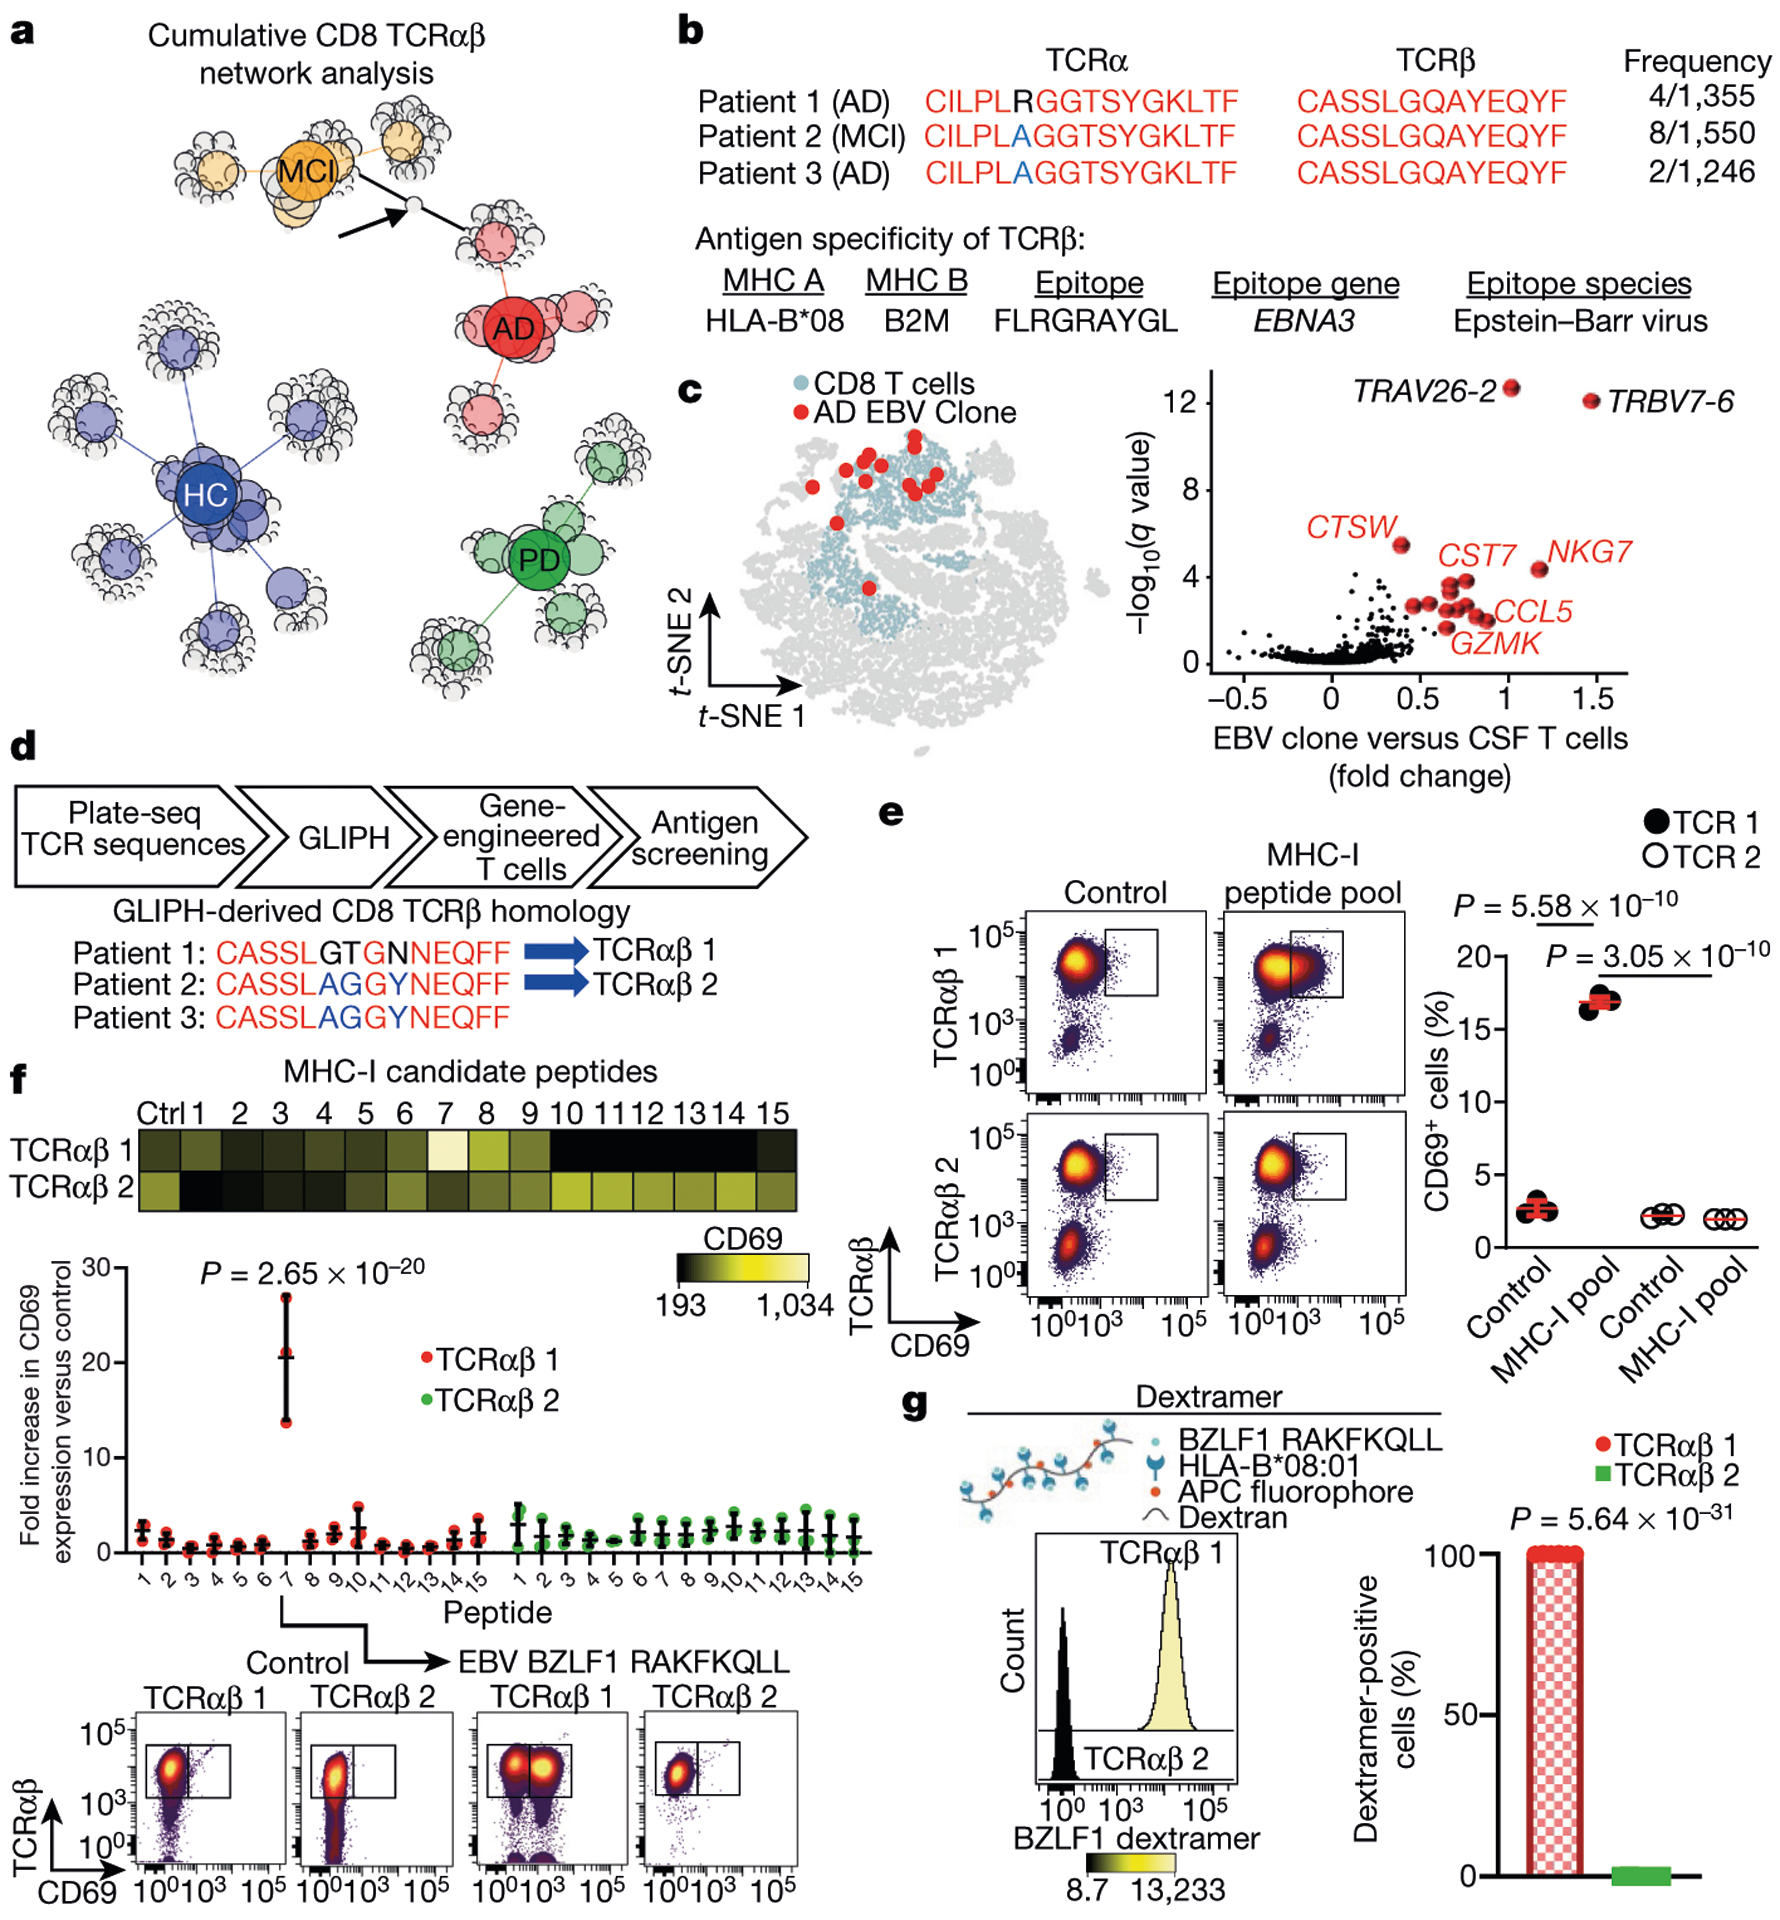
a, Unweighted network analysis of CD8 T CRαβ sequences combined from plate-seq and drop-seq experiments. Group node IDs with individual TCRαβ clones are depicted as circles and sized according to the proportion of total sequences of each clone. Arrow indicates a shared clonal T CRaP sequence with specificity for EBV EBNA3A. Note that several healthy control (HC) subjects have no clones. b, Shared TCRαβ sequences among patients with MCI or AD. Three patients had identical TCRβ chains with specificity for EBV EBNA3A. The antigen specificity of T CRβ is shown below19. c, Differential expression of EBV-specific clones in MCI and AD (from n = 3 subjects) versus all CSF T cells shows enhanced expression of cytotoxic effector genes. MAST differential expression test with Benjamini-Hochberg correction. d, Workflow for antigen identification of CSF TCRs. GLIPH was applied to TCR sequencing to derive homologous TCR sequences between patients. GLIPH identified two patients with AD who had identical TCRβ chains and a third patient with a similar sequence. The T CRαβ sequences derived from GLIPH were introduced into SKW-3 cells. e, Autologous fibroblasts were used to present antigens to TCRαβ 1 and TCRαβ 2 cells. Only TCRαβ 1 cells showed significant upregulation of CD69 following antigen presentation. Data are averages from three separate experiments performed in triplicate.Mean ± s.e.m.; one-way analysis of variance (ANOVA) (F(3, 8) = 1,050,P = 1.01 × 10⁻¹⁰) with Tukey’s multiple comparisons test. f, Peptide 7 (RAKFKQLL) of the EBV trans-activator BZLF1 protein activates TCRαβ 1 but not TCRαβ 2 cells. Two-way ANOVA (F(14, 60) = 14.06, P =4.8 × 10⁻¹⁴) followed by Sidak’s multiple comparisons test. Data were pooled from n = 3 independent experiments. The P value shown is from comparing peptide 7 values for each cell line. Mean ± s.d. g, A fluorescent dextramer composed of H LA-B*08:01 presenting the BZLF1 peptide RAKFKQLL shows nearly 100% positivity with TCRαβ 1 but no positivity with TCRαβ 2 cells. Unpaired two-sided t-test with Welch’s correction (n = 6 per group).