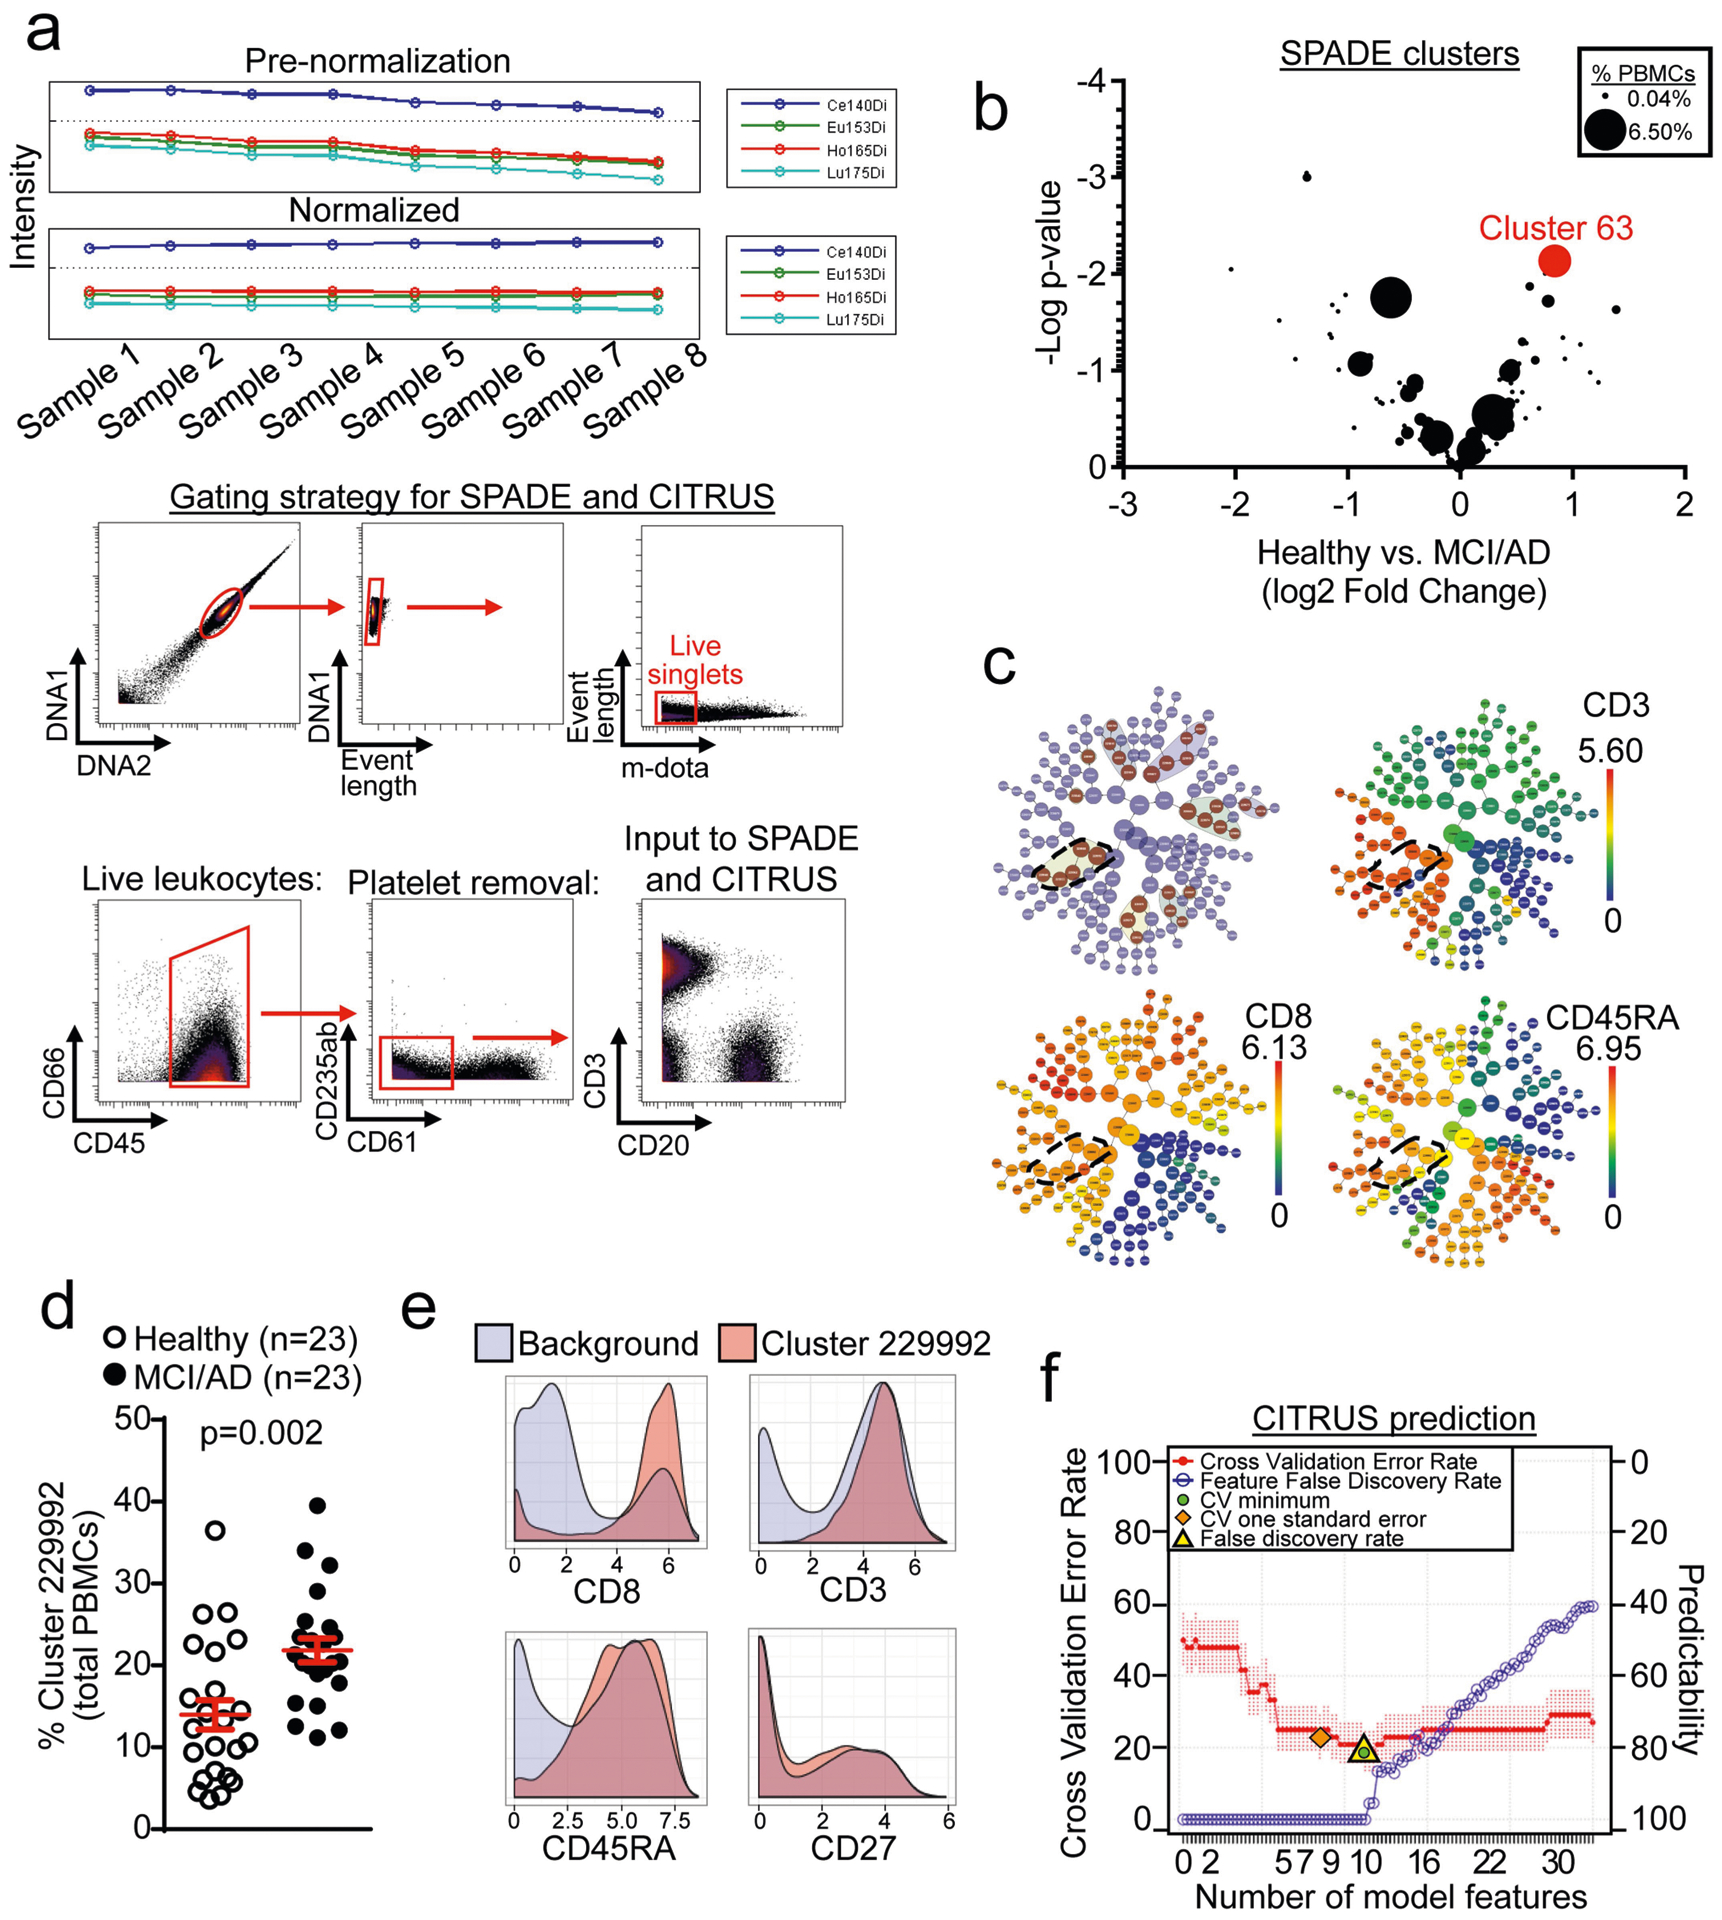
Extended Data Fig. 3 |. Mass cytometry SPADE and CITRUS clustering shows increased numbers of CD8+ TEMRA cells in MCI or AD.

a, Normalization of mass cytometry data was performed before all analyses. A gating strategy for input into downstream analyses is shown. Live, single leukocytes were selected for analysis. b, Plotting of clusters by P value and fold change of each cluster reveals cluster 63 as the most highly increased cluster among patients with MCI or AD. Clusters are sized according to their percentage of total PBMCs. Unpaired two-sided t-test (n = 57 healthy; n = 23 MCI or AD). c, CITRUS clustering showing significant differentiating populations (top left). Cluster 229992 and its significant daughter populations are outlined. Expression of CD3, CD8 and CD45RA shows that cluster 229992 corresponds to CD8+ TEMRA cells. d, Quantification of cluster 229992 cells as a percentage of total PBMCs for individual subjects. Percentages of this cluster are significantly higher in patients with MCI or AD than healthy control individuals. Unpaired two-sided t-test with Welch’s correction; mean ± s.e.m. e, Marker expression of cluster 229992 shows it to be a CD3+CD8+CD45RA+CD27− TEMRA population. f, The regularized supervised learning algorithm from CITRUS predicts disease group with a 20% error rate (80% positive predictability). The number of model features increases from left to right. The most predictive model is shown as the lowest cross validation error rate (red line) constrained by the false discovery rate (yellow triangle).
