FIGURE 2.

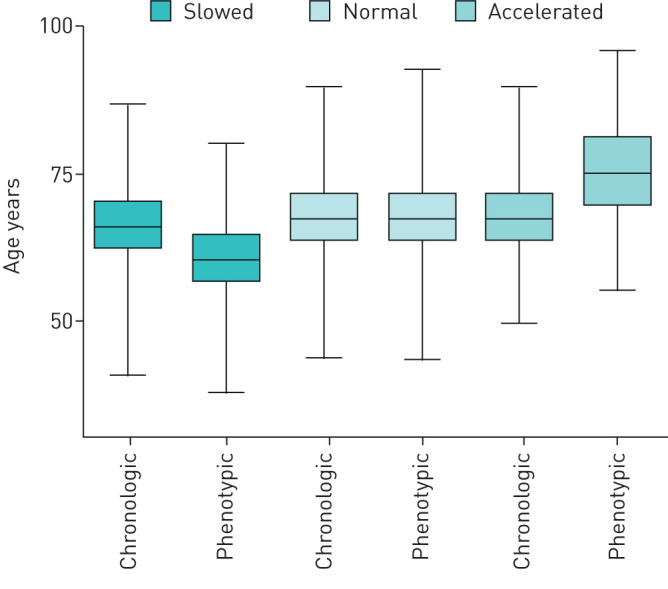
Box-and-whisker diagram of chronological and phenotypic age. Three quartiles and the minimum and maximum values of the chronological and phenotypic age are shown.

Box-and-whisker diagram of chronological and phenotypic age. Three quartiles and the minimum and maximum values of the chronological and phenotypic age are shown.