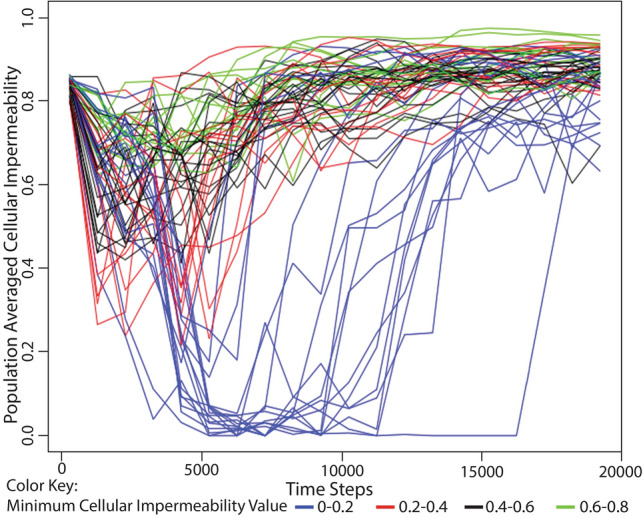
Fig. 3.

Change in population-averaged cellular impermeability levels in response to changing conditions of environmentally available processing energy. Each of these simulations began with a large pool of processing energy in the environment (10,000 energy parcels with 500 processing energy units, each). The initial environmental energy pool was not replenished and thus diminished over time due to its consumption by organisms. Organisms at the beginning of each simulation had three cellularity genes (i.e., 87.5% cellular impermeability). These simulations were run 100 times each with a maximum population size of 1000. Out of the 100 simulations, 66 had populations that survived to the 100,000th time step while 34 had populations that died out (not shown). Simulations are color-coded by the minimum population-averaged cellular impermeability value: 0–0.2 (blue), 0.2–0.4 (red), 0.4–0.6 (black), and 0.6–0.8 (green). The populations in all simulations showed a temporary decrease in average cellular impermeability in response to environmentally available processing energy and a subsequent increase in average cellular impermeability after that processing energy resource was exhausted. These results demonstrate that the selection pressures favoring non-cellularity in an energy-rich environment and favoring cellularity in an energy-poor environment are reversible and that populations can often survive that reversal
