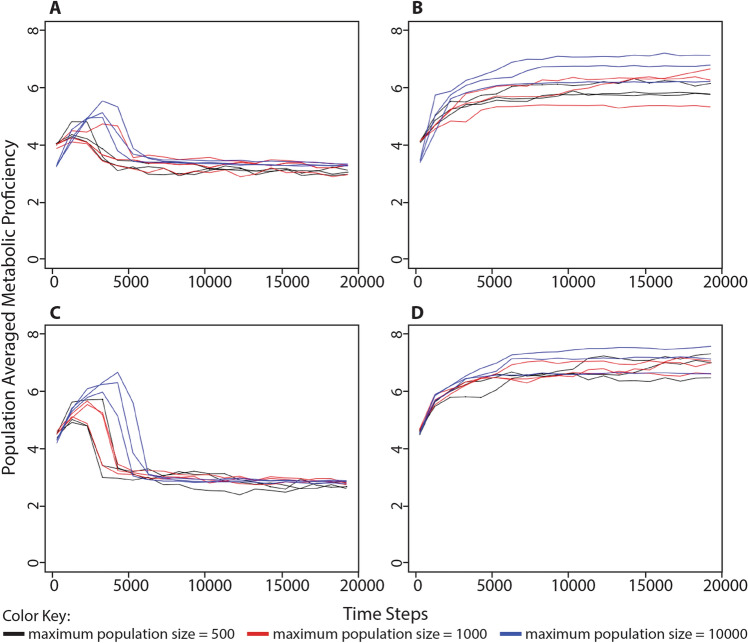
Fig. 4.
Change in population-averaged metabolic proficiency in different conditions of environmentally available energy. The population-averaged metabolic proficiency was measured alongside the series of simulations described in Fig. 2. a Organisms began each simulation with 0 cellularity genes (i.e., 0% cellular impermeability) in an environment with unlimited food puzzles and processing energy. b Organisms began each simulation with 0 cellularity genes (i.e., 0% cellular impermeability) in an environment with unlimited food puzzles, but a limited number of energy parcels in the environment, equivalent to 25% the maximum population capacity. c Organisms began each simulation with 3 cellularity genes (i.e., 87.5% cellular impermeability) in an environment with unlimited food puzzles and processing energy. d Organisms began each simulation with 3 cellularity genes (i.e., 87.5% cellular impermeability) in an environment with unlimited food puzzles, but a limited number of energy parcels in the environment, equivalent to 25% the maximum population capacity. Each of the above scenarios was run three times each at three different maximum population sizes: black = 500; red = 1000; blue = 10,000. Simulations were run for 100,000 time steps although only the first 20,000 steps are shown. Cellular impermeability values were recorded every 1000 steps following the first recording at step 250. Taken together, these results demonstrate that environments with limited environmentally available processing energy select for an increase in metabolic proficiency, while environments with abundant processing energy select for a level of metabolic proficiency equivalent to that of a random genome

