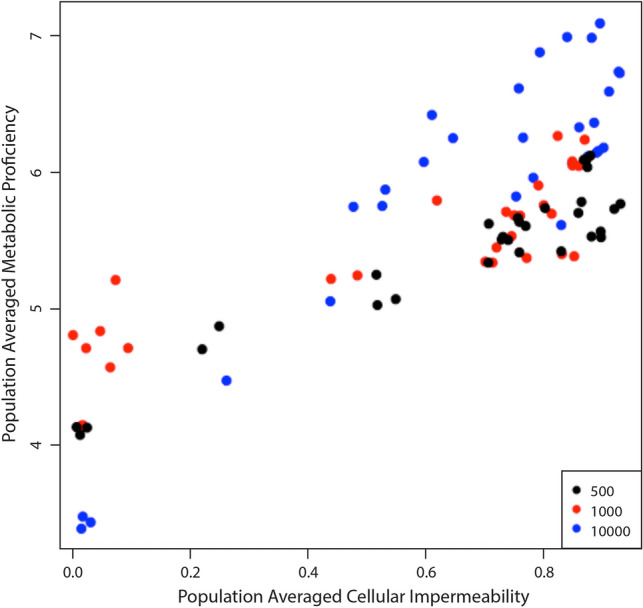
Fig. 5.

The relationship between cellular impermeability and metabolic proficiency. Results are shown from the simulations in which organisms began with 0 cellularity genes (i.e., 0% cellular impermeability) in an environment with unlimited food puzzles, but a limited number of energy parcels. Cellular impermeability and metabolic proficiency values were recorded every 1000 steps following the first recording at step 250. Color coding refers to the maximum population size of each simulation: black = 500; red = 1000; blue = 10,000. In these simulations, both population-averaged cellularity and populations-averaged metabolic proficiency increased (Figs. 2b and 4b). When shown as a scatterplot, it is clear that cellular impermeability and metabolic proficiency evolve together. Furthermore, the population-averaged values of these traits are very strongly correlated (r = 0.84, p = 6.07 × 10⁻²⁵), indicating that they are coevolving
