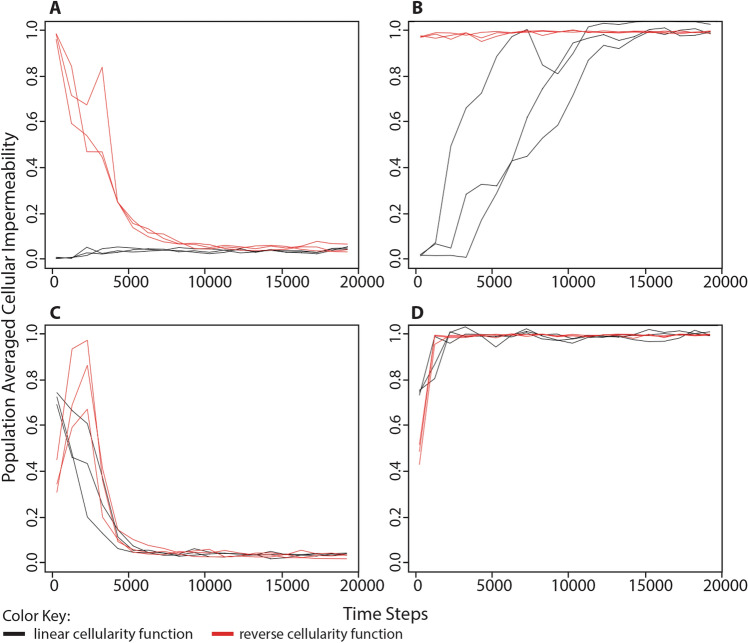
Fig. 6.
Change in population-averaged cellular impermeability levels in different conditions of environmental energy using alternate cellularity function. The same simulations were performed as shown in Fig. 2 except that the level of cellular impermeability was determined by the number of cellularity genes using either a linear function, cellular impermeability = 0.25n, shown in black, or a reverse of the original function, cellular impermeability = 0.5n, shown in red. a Organisms began each simulation with 0 cellularity genes (i.e., 0% cellular impermeability in the linear function or 100% cellular impermeability in the reverse function) in an environment with unlimited food puzzles and processing energy. b Organisms began each simulation with 0 cellularity genes in an environment with unlimited food puzzles, but a limited number of energy parcels in the environment equivalent to 25% the maximum population capacity. c Organisms began each simulation with 3 cellularity genes (i.e., 75% cellular impermeability in the linear function or 12.5% cellular impermeability in the reverse function) in an environment with unlimited food puzzles and processing energy. d Organisms began each simulation with 3 cellularity genes in an environment with unlimited food puzzles, but a limited number of energy parcels in the environment equivalent to 25% the maximum population capacity. These results demonstrate that the previously observed evolution of cellularity in response to the availability of processing energy in the environment is not affected by changes in the way that cellularity is determined by genome content

