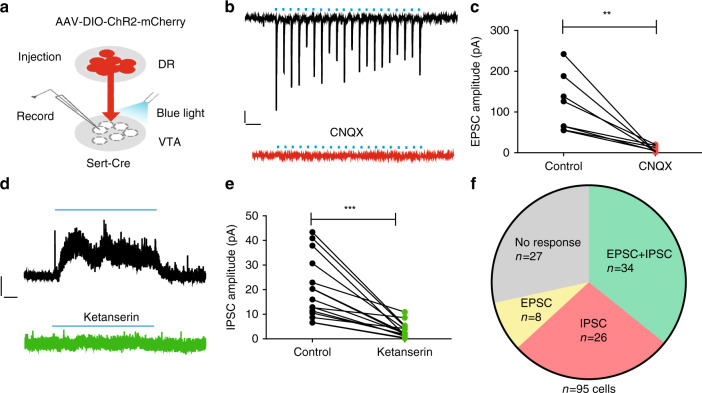
Fig. 2. Activating serotonergic terminals elicits glutamate and 5-HT release.
a Schematic diagram showing whole-cell patch-clamp recordings from the VTA following the Cre-dependent expression of ChR2 in the DR of Sert-Cre mice. b Representative recording trace from a VTA neuron showing a fast EPSC evoked by the light stimulation (5 ms, 20 Hz) of DR axonal terminals (upper panel). Stimulation-induced EPSCs were abolished by the application of CNQX, an AMPA/kainate receptor antagonist (lower panel). Scale, 50 pA,100 ms. c Summary data showing that the amplitudes of light-evoked EPSCs were almost completely abolished by the application of CNQX; (n = 8 cells from three mice; paired t-tests, t7 = 4.172, P = 0.004). d Example of a voltage-clamp (0 mV) trace from optogenetic stimulation (30 s 20 Hz) of ChR2+ axonal terminals produced outward current that was largely blocked by ketanserin, a 5-HT2A, and 5-HT2C receptor antagonist. Scale, 20 pA, 4 s. e Summary data showing that the amplitudes of light-evoked IPSCs were significantly reduced by ketanserin (n = 15 cells from four mice; paired t-tests, t14 = 5.409, P = 0.000092). f Pie chart showing the distribution of response types in VTA neurons evoked by either single pulses (EPSC) or trains (IPSC) of optical stimulation of DR axons. EPSCs were measured at −70 mV and IPSCs at 0 mV. Data are represented as mean ± SEM; **P < 0.01, ***P < 0.001. Source data are provided as a Source Data file.

