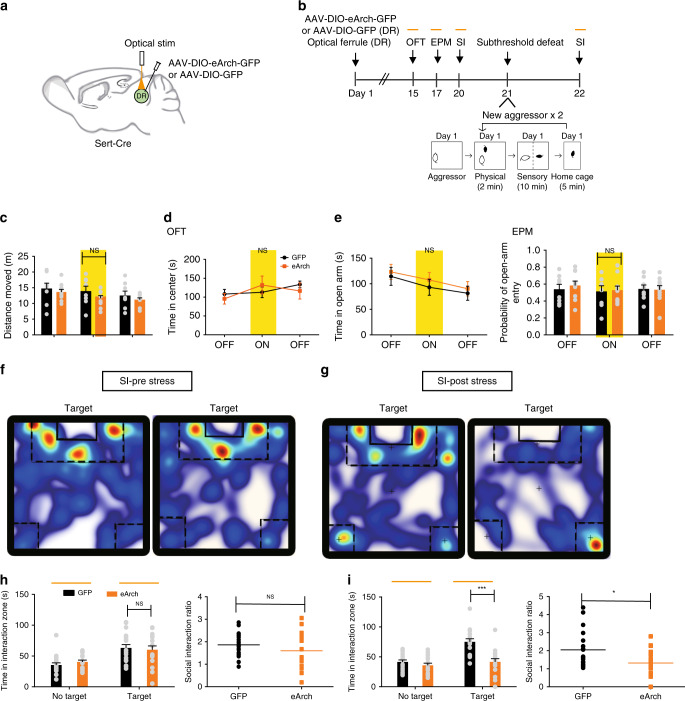
Fig. 4. Silencing of DR 5-HT neurons induces social interaction deficits.
a Schematic of viral injections and optic fiber implantations in the DR for optogenetic manipulation. b Experimental timeline of the inhibition of DR serotonergic neurons (top panel). Schematic of the subthreshold paradigm (bottom panel). c–e Silencing of DR serotonergic neurons had no effect on locomotion in the open field test (OFT; eArch, n = 10 mice; GFP, n = 8 mice; one-way ANOVA, F1,16 = 1.866, P = 0.191) (c) or anxiety-like behavior in the OFT (eArch, n = 10 mice; GFP, n = 8 mice; one-way ANOVA, F1,16 = 0.435, P = 0.519) (d), or elevated plus maze (EPM; eArch, n = 10 mice; GFP, n = 8 mice; one-way ANOVA, time: F1,16 = 0.452, P = 0.511, probability: F1,16 = 0.31, P = 0.862) (e). f, g Representative traces of animals expressing eArch in DR serotonergic neurons during the social interaction test with light stimulation (f) or after subthreshold defeat stress with optical stimulation (g). Warmer colors indicate more time spent. h No significant difference was observed for time spent in the interaction zone (eArch, n = 17 mice; GFP, n = 19 mice; one-way ANOVA, F1,34 = 0.126, P = 0.724) or the social interaction ratio during the silencing of DR 5-HT neurons; (eArch, n = 17 mice; GFP, n = 19 mice; one-way ANOVA, F1,34 = 1.351, P = 0.253). i Inhibition of DR serotonergic neurons following subthreshold defeat stress exposure elicits social aversion; (eArch, n = 17 mice; GFP, n = 19 mice; one-way ANOVA, interaction: F1,34 = 20.751, P < 0.001, SI ratio: F1,34 = 6.037, P = 0.019). Data are represented as mean ± SEM. NS: not statistically significant; *P < 0.05, ***P < 0.001. Source data are provided as a Source Data file.

