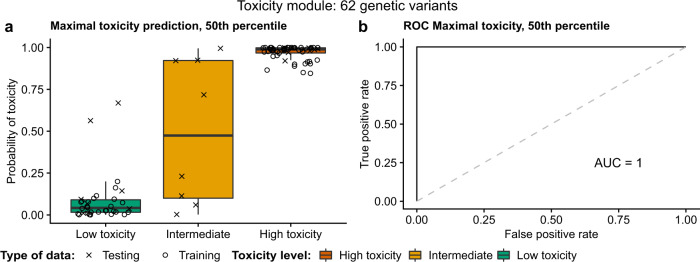
Fig. 7. Toxicity module prediction model.
Shows the best maximal toxicity prediction model based on the toxicity module. It consists of 62 genetic variants (the 50th percentile most used variants in the random LASSO permutations). a Patients (separated by registered maximal toxicity) and their predicted probability of maximal toxicity. b ROC curve of the model’s predictions of high and low maximal toxicity. Note that the intermediates were not used for calculating the ROC. The box-plot elements should be interpreted as the following: centerline, median; box limits, upper and lower quartiles; whiskers, 1.5× interquartile range.

