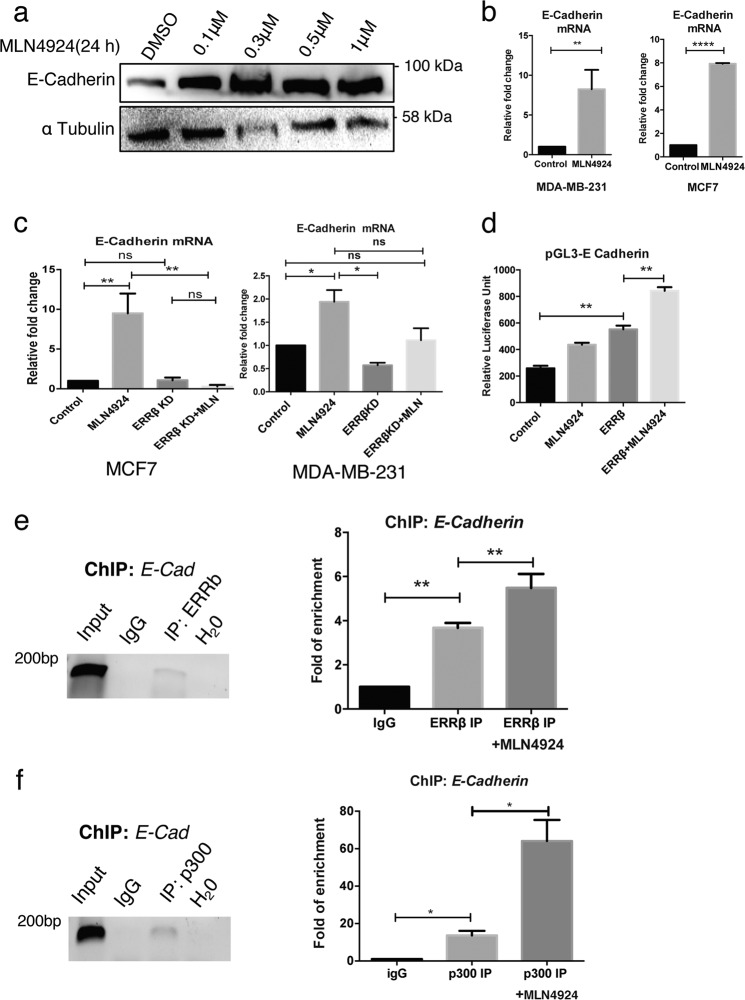
Fig. 7. MLN4924 promotes ERRβ-mediated E-Cadherin expression.
a MDA-MB-231 were treated with varying concentrations (0.1, 0.3, 0.5 and 1.0 µM) of MLN4924 for 24 h prior to western blot analysis. α-Tubulin was used as a loading control. (N = 3). b MDA-MB-231 (left panel) and MCF7 (right panel) cells were treated with 1 µM MLN4924 for 24 h prior to qRT-PCR analysis. (N = 3). The data represent the means ± SD. (Two-tailed t test; Significant: **P < 0.01; ****p < 0.0001, significant). c MDA-MB-231 (right) and MCF7 (left) cells were transfected with ERRβ shRNA and relative mRNA level of E-Cadherin were analysed after 1 µM MLN4924 treatment for 48 h. (N = 3). The data represent the means ± SD. (two-tailed t test; Significant: *P < 0.05; **P < 0.01, significant) d MCF7 cells were transfected with E-Cadherin promoter cloned upstream of the pGL3 luciferase reporter and ERRβ shRNA, with and without 1.0 µM MLN4924 treatment. Graphical representation showed relative luciferase unit of the Renilla luciferase reporter activity. (N = 3). The data represent the means ± SD (One-way ANOVA test; Significant: **P < 0.01, significant). e Chromatin Immunoprecipitation was performed with the ERRβ antibody on the promoter region of E-Cadherin and analysed with electrophoresis (left; image colour invested) and qRT-PCR (right). Anti-IgG antibody was used as a negative control. (N = 3). f Chromatin immunoprecipitation was performed with a p300 antibody on the promoter region of endogenous E-Cadherin and analysed with electrophoresis (left; image colour invested) and qRT-PCR (right). Anti-IgG antibody was used as a negative control. (N = 3). The data represent the means ± SD. (two-tailed t test; Significant: *P < 0.05, significant).

