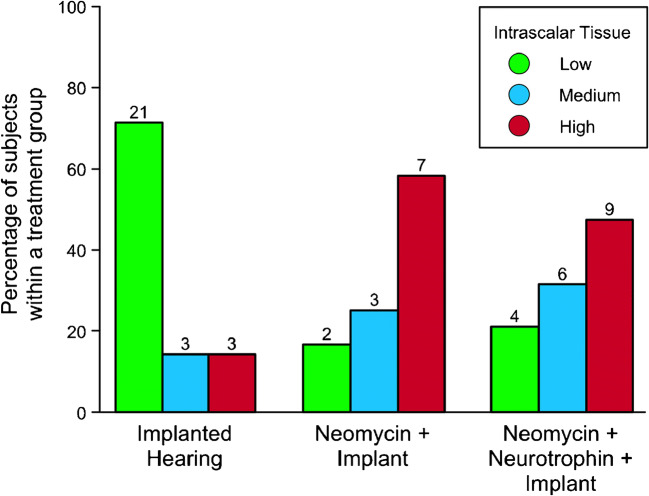
Fig. 3.
Occurrence of intrascalar tissue differed between treatment groups. Bars indicate the percentage of subjects in each treatment group with the indicated level of intrascalar tissue in the treated ear. Numbers above the bars indicate the number of subjects in each treatment group with each level of intrascalar tissue

