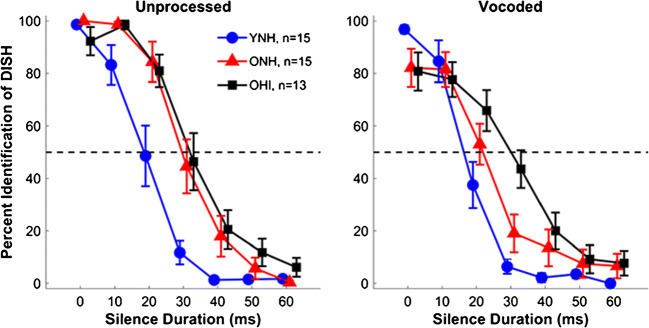
Fig. 3.
Split-plot ANOVA revealed aging effects: YNH listeners show earlier 50 % crossover points on perceptual identification functions than ONH and OHI listeners (P < 0.001), but no differences are noted between ONH and OHI listeners. YNH listeners also show steeper slopes than the OHI listeners (P = 0.005), but no other groups differences were noted (all P values > 0.05). Group average comparisons for perceptual identification functions are displayed for unprocessed and vocoded stimuli obtained from YNH (blue), ONH (red), OHI (black) listeners. Error bars show ± 1 standard error. The Ns for each group are displayed with the legend in the left panel. Note that two OHI listeners were not included in the perceptual data as they were unable to complete the training task

