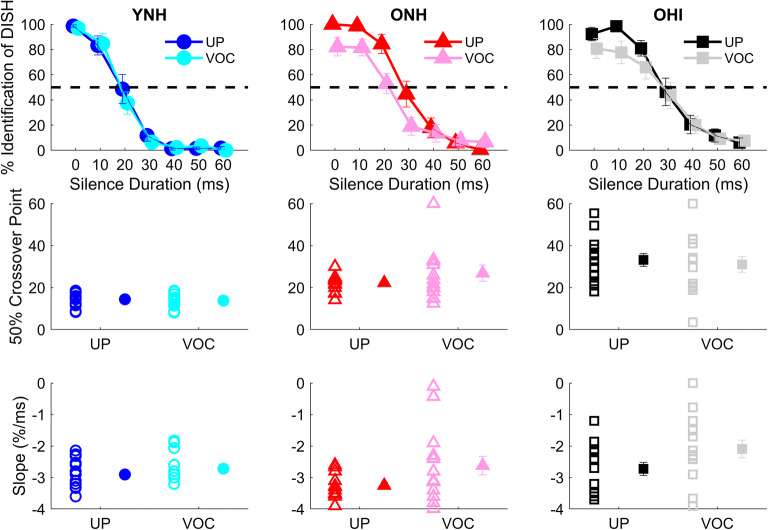
Fig. 4.
Split-plot ANOVA revealed minimal effects of vocoding: ONH listeners had shallower slopes in the vocoded compared to the unprocessed conditions (P = 0.001), but no other vocoding effects were found for slope or crossover point. Top row: group average perceptual identification functions in young normal-hearing (YNH), older normal-hearing (ONH), and older hearing-impaired (OHI) listeners for unprocessed and vocoded stimuli. Middle row: individual (open symbols) and group mean (closed symbols) values for 50 % crossover points for the perceptual identification functions. Bottom row: individual (open symbols) and group mean (closed symbols) values for slope to vocoded and unprocessed DISH and DITCH stimuli. Symbols: YNH: unprocessed = blue circles, vocoded = cyan circles; ONH: unprocessed = red triangles, vocoded = pink triangles; OHI: unprocessed = black squares, vocoded = gray squares. Error bars show ± 1 standard error. **P < 0.01

