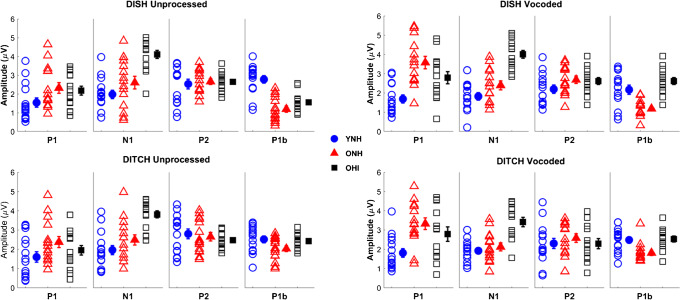
Fig. 9.
Split-plot ANOVAs revealed that vocoding increases P1 amplitudes in both ONH (P < 0.001) and OHI (P < 0.01) listeners but not in YNH listeners (P = 0.37). In contrast, vocoding decreases N1 amplitudes across groups (P = 0.038). Individual (open symbols) and group mean (closed symbols) for cortical amplitudes to DISH (top panels) and DITCH (bottom panels) in unprocessed (left column) and vocoded (right column) conditions in YNH (blue circles), ONH (red triangles), and OHI (black squares) listeners. Error bars show ± 1 standard error

