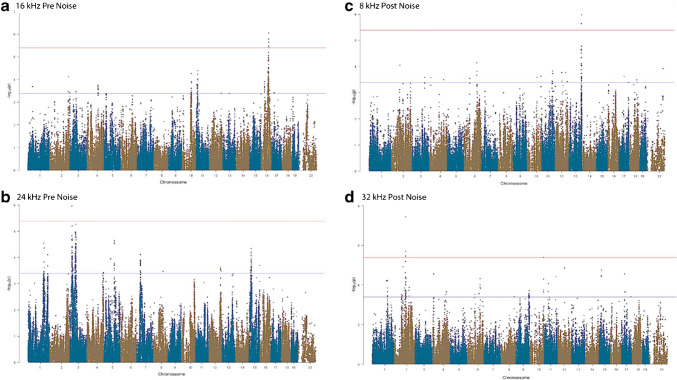
Fig. 5.
GWAS results for ABR wave 1 P1-N1 suprathreshold amplitude in the HMDP. Manhattan plots showing the association (−log10) p values (−logP) for 16 kHz (a) and 24 kHz (b) at pre-noise and 8 kHz (c) and 32 kHz (d) post-noise exposure in 102 HMDP mouse strains. The analysis was performed using ~ 200,000 SNPs with a minor allele frequency > 5 %. Each chromosome is plotted on the x-axis in alternating brown and blue colors. SNPs on Chr. 16, Chr. 3, Chr. 13, and Chr. 2 exceeded the predetermined genome-wide significance threshold (−logP = 5.39 red line)

