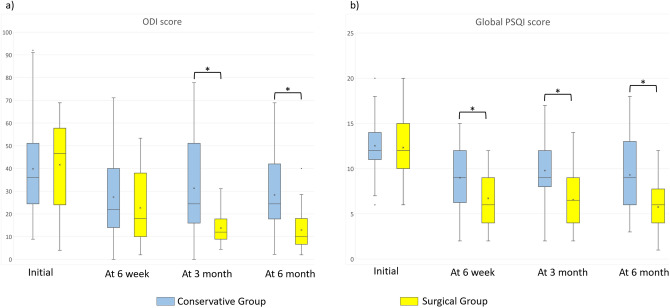
Figure 2.
Comparison of changes in clinical profile within the matched cohorts (*significant intergroup difference of p < 0.05). (a) Comparison of Oswestry Disability Index (ODI) score. (b) Comparison of Pittsburgh sleep quality index (PSQI) score. Middle line in the box: median value; x mark within the box: mean value; upper and lower edges of box: interquartile range including 50% of the observations; dots outside box: outliers. Whisker lines extend for 1.5 times the interquartile range.

