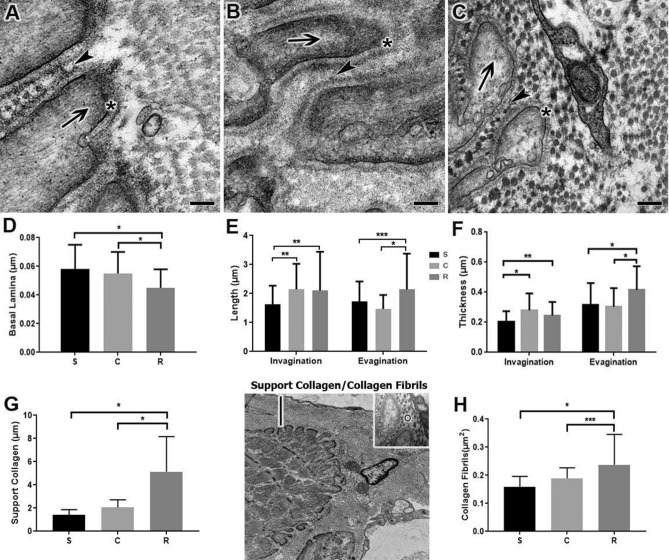
Figure 2.
Transmission electron micrographs of the surface of the myotendinous junction reveal the sarcoplasmatic evaginations (arrows) interacting with the sarcoplasmatic invaginations (arrowheads) of the Sedentary (A), Calisthenic (B) and Resistance (C) groups. Scale Bar: 1 μm. Magnifications: 80,000× (A–C). (D) Means ± SD of basal lamina (*) thickness *(p < 0.0001). (E) Means ± SD of the lengths of the sarcoplasmatic invaginations and evaginations *(p < 0.0001), **(p < 0.001), ***(p < 0.01). (F) Means ± SD of invagination and sarcoplasmatic evagination thickness *(p < 0.0001), **(p < 0.001). Transmission micrograph identifying the light bar on the MTJ and highlighting the diameter representation of collagen fiber in this region (circle). (G) Means ± SD of the support collagen thickness *(p < 0.0001). (H) Means ± SD of the collagen fibril diameter in the MTJ *(p < 0.0001), ***(p < 0.01). Support collagen/collagen fibrils. The micrographs show the definition of the thickness of the support of the collagen fibrils layer adjacent to the MTJ and prominently positioned lengthwise in the layer of support where it was possible to measure its diameter.

