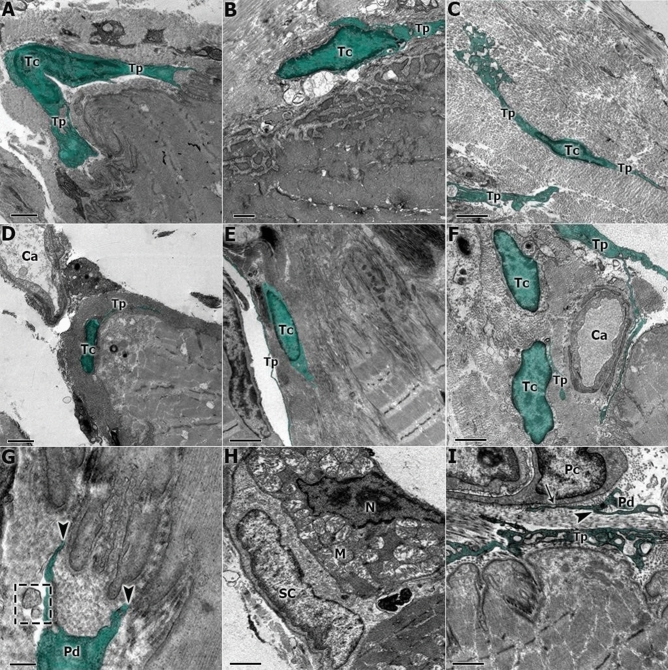
Figure 3.
(A) The transmission electron micrograph of S shows the telocyte (Tc) adjacent to the MTJ and the telopodes (Tp). (B) The C group shows the ultrastructural adaptations of the MTJ and the interactions of the telocytes (Tc) in this region. (C) In the R group, we can observe a telocyte (Tc) with your telopodes (Tp) in proximity with the MTJ interface and surrounded by transversal collagen fibrils. (D) In S, we found evidence of capillaries (Ca) associated with telocytes (Tc) adjacent to the myotendinous region. (E) In C, the interactions of the telopodes (Tp) and telocytes were observed in the support collagen region associated with the MTJ. (F) Telocytes (Tc) adjacent to the blood capillary (Ca) in the MTJ. (G) In the S group at higher magnification; it is possible to observe the activity and contact between the telopodes terminals (Pd) that possible perform a paracrine activity with the sarcoplasmatic invaginations of the MTJ (arrowhead) and the vesicles released in this region (square). (H) In the C group it was possible to visualize the nucleus of a muscle cell (N), mitochondrial clusters (M), and a satellite cell (SC) in the MTJ. (I) At higher magnification, the communication junction (arrow) between telopodes (Tp) and the pods with pericytes (Pc) (arrowhead) in group R. Scale Bar: 1 µm (A,B,D,F); 2 µm (C,E,H,I) 0.2 µm (G). Magnifications: 4,500× (E); 5,000× (C,D); 6,000× (F); 8,000× (B); 10,000× (A); 15,000× (H,I), 40,000× (G).

