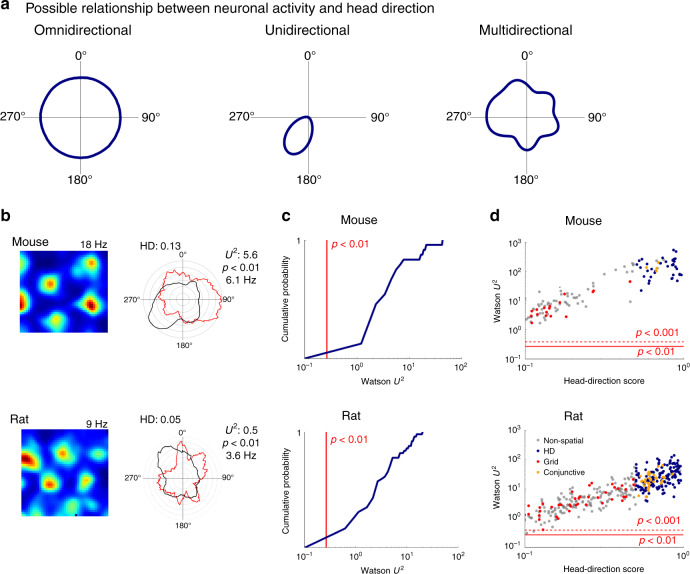
Fig. 1. Grid cell firing is modulated by head direction.
a Schematics of omnidirectional, unidirectional and multidirectional tuning. b Examples of firing rate maps (left) and head direction histograms (right) for grid cells from mice (upper) and rats (lower). Polar histograms show binned counts of head direction across all video frames (black) and the mean firing rate for each head direction bin (red). The head direction score (HD), two-sided Watson U2 test statistic and corresponding significance estimate and maximum firing rates for each cell are indicated adjacent to the polar plot. c Cumulative probability of the two-sample Watson U2 test statistic comparing the distribution of head directions when each cell fired with the distribution of head directions for the entire trajectory within the recording session (mice: p < 0.001 for 34/34 cells, rats: p < 0.01 for 68/68 cells). d Two-sample Watson test statistics plotted as a function of head direction score for pure grid cells (red), head direction cells (blue), conjunctive cells (orange) and other cells (grey). The red lines indicate significance levels p < 0.001 (dashed) and p < 0.01 (solid).

