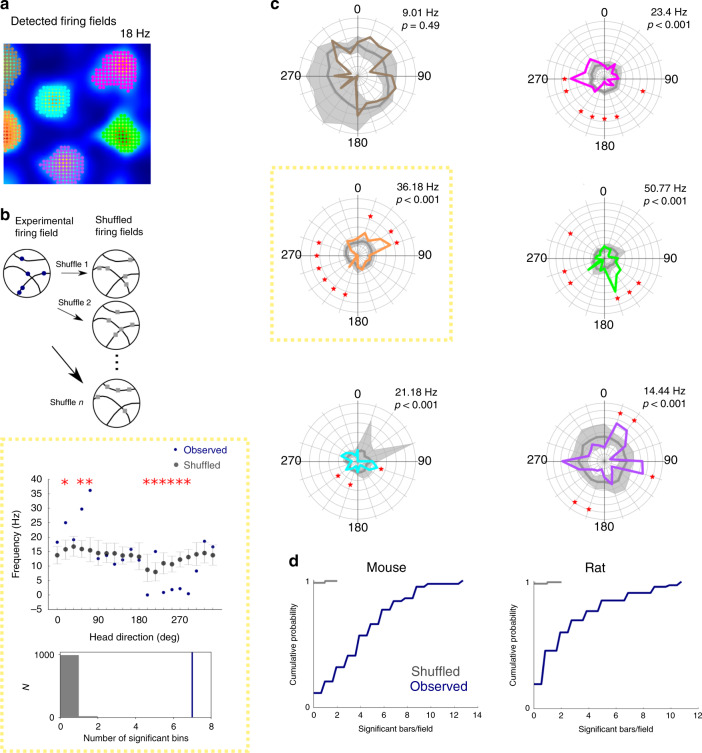
Fig. 3. Individual firing fields are modulated by head direction.
a Firing rate map of the mouse grid cell from Fig. 1b with colour-coded automatically detected firing fields. b Schematic of shuffling method (upper), example directional firing rate histogram for observed and shuffled spikes (middle) for the highlighted field from c (yellow box) and distribution of the number of significant bins from the shuffled data (grey) and the observed data (blue) (lower). The error bars represent the 90% confidence interval of the shuffled distribution and the measure of centre is the mean. Asterisks indicate bins in which the observed data differs significantly from the shuffled data (p < 0.05, two-tailed p value calculated from the shuffled distribution and corrected for multiple comparisons with the Benjamini–Hochberg procedure). c Distributive plots for each firing field (coloured according to a, field in yellow box also shown in b). The maximum firing rates are shown above the head direction plots. Significantly directional bins (p < 0.05, two-tailed p value calculated from the shuffled distribution and corrected for multiple comparisons with the Benjamini–Hochberg procedure) are marked with an asterisk (*). d The number of directional bins (out of 20 bins) that differ significantly (threshold p < 0.05 after correction for multiple comparisons) from the shuffled data. The numbers of significant bins differed between observed and shuffled data (mice: n = 44 fields from 13 grid cells, p = 5.1 × 10⁻²³, U = 9.88, rats: n = 83 fields from 25 grid cells, p = 1.2 × 10⁻¹⁸, U = 8.81, two-sided Mann–Whitney U test).

