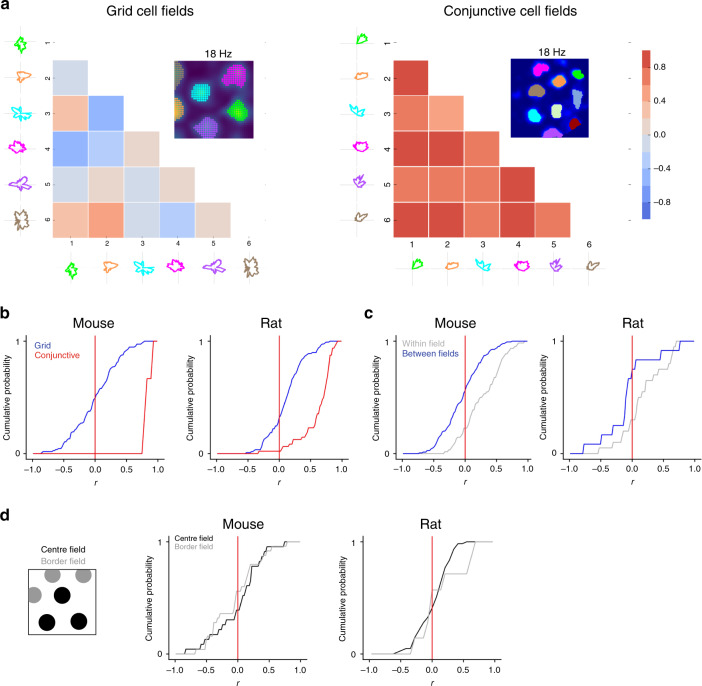
Fig. 4. Directional modulation depends on location.
a Example of pairwise correlation of directionally binned firing of a pure grid cell (left) and a conjunctive cell (right). b Distribution of the coefficients obtained by Pearson correlation between different fields from the same grid or conjunctive cells calculated as in a. The distribution for grid cells differed from the distribution for conjunctive cells (for mice: D = 0.98, p = 1.5 × 10⁻⁸; for rats: D = 0.72, p = 2.2 × 10⁻¹⁶; two-sided Kolmogorov–Smirnov test). c Correlations between firing rate histograms for the same field (blue) and between different fields (grey) generated from data from the first and second halves of each session. The distribution of correlation coefficients for the within-field correlations differed from the between-field correlations (for mice: p = 3.3 × 10⁻⁶, D = 0.38; for rats: p = 0.018, D = 0.53; two-sided Kolmogorov–Smirnov test). d Border and centre fields were defined based on whether they contacted the border of the enclosure (left). Cumulative histograms show the distribution of correlation coefficients calculated as in b but with central and border fields shown separately.

