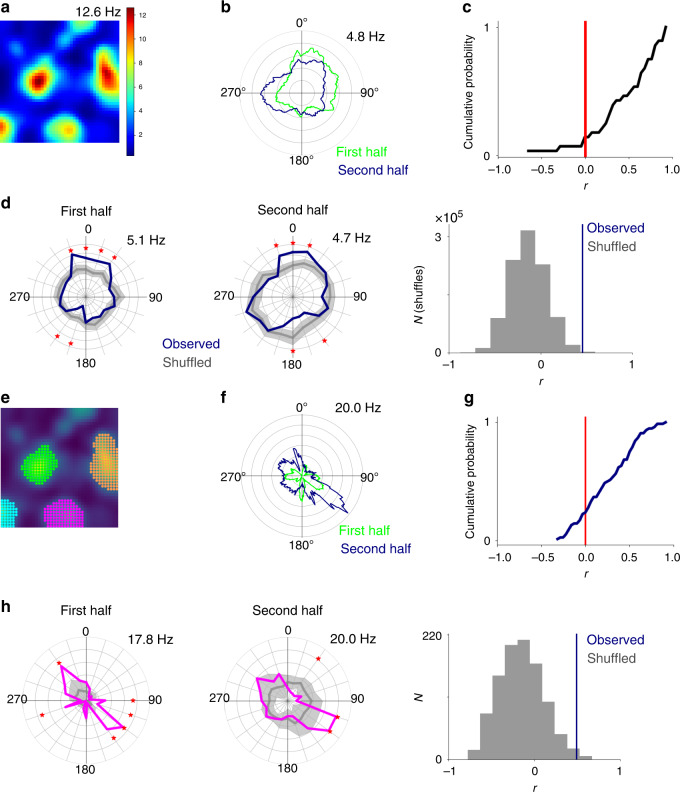
Fig. 5. Stability of head direction preferences.
a, b Example firing rate map (a) and classic head direction plots for the first (green) and second half (blue) of the recording session (b). c Cumulative probability of Pearson correlation coefficients (mean = 0.47 ± 0.39) calculated as in b for all pure grid cells from mice. The median of the distribution of correlation coefficients differed from 0 (Wilcoxon one-sample signed-rank test, p = 4 × 10⁻⁵, T = 23). d Distributive head direction plots for spikes from the first and second half of the session for the neuron in a and comparison of the correlation coefficient for the observed data (blue) with the distribution of coefficients generated from the shuffled data (grey). e, f Firing rate map colour coded by field (e) and corresponding classic head direction plot for the first (green) and second half (blue) of the recording session (f) for the pink grid field shown from e. g Distributions of Pearson correlation coefficients for all fields calculated as in f. The median (0.29 ± 0.31 for mice) differed from zero (two-sided Wilcoxon test p = 3.37 × 10⁻⁹, T = 321, n = 44). h Distributive head direction plots for the first and second half of the session for the field in f and comparison of the correlation coefficient for the observed data (blue) with the distribution of coefficients generated from the shuffled data (grey).

