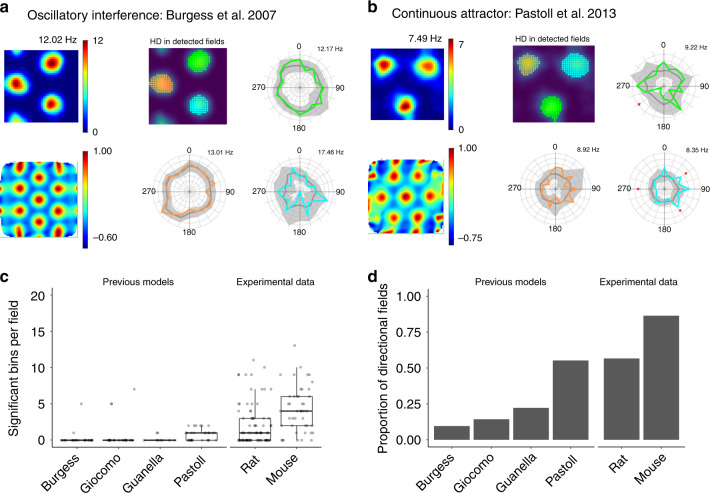
Fig. 6. Existing models do not account for directional modulation of grid firing.
a, b Firing rate map (upper left), autocorrelogram (lower left), detected fields (upper centre) and distributive plots for the colour-coded fields for two types of grid models ran on our trajectory data. c Number of significant bins per field compared across previous grid cell models and experimental data. Each of the previous models (Burgess, Giocomo, Guanella and Pastoll9,12,13,23) differed significantly from the mouse data (p = 5.7 × 10⁻⁸, p = 9.6 × 10⁻⁵, p = 3.4 × 10⁻⁸, p = 4.2 × 10⁻⁷, respectively, one-way ANOVA with Games–Howell test), and each of the models differed significantly from the rat data, with the exception of Giocomo (p = 6.7 × 10⁻⁴, p = 0.32, p = 4.1 × 10⁻⁵, p = 6.1 × 10⁻³, respectively). d Proportion of directionally modulated fields compared across existing grid cell models and experimental data.

