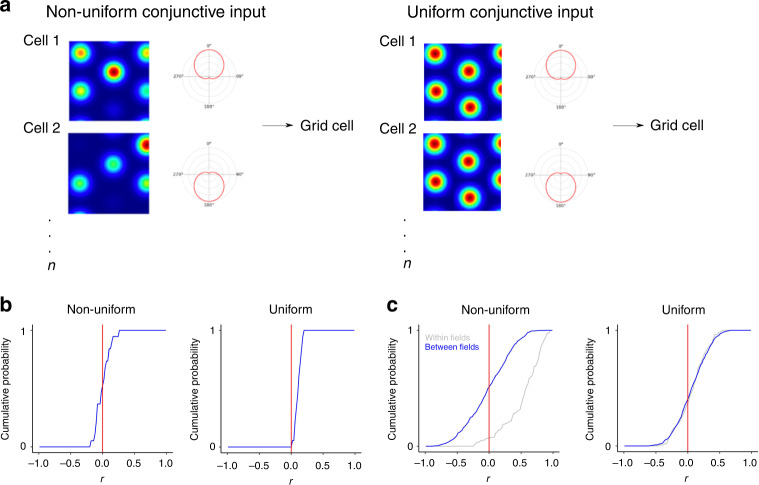
Fig. 8. Location-dependent firing emerges when conjunctive cell activity is spatially non-uniform.
a Schematic of uniform and non-uniform conjunctive cell input models. b Distribution of average Pearson coefficients from correlation between fields of simulated grid cells calculated as in Fig. 4b. The distribution of correlation coefficients differed between uniform and non-uniform conjunctive input models (p = 3.99 × 10⁻⁶, D = 0.21, two-sided Kolmogorov–Smirnov test). c Correlations between firing rate histograms for the same field (grey) and between different fields of the same cell (blue) generated as in Fig. 4. The between- and within-field distributions differed from one another for the non-uniform model (p = 2.2 × 10⁻¹⁶, D = 0.62, two-sided Kolmogorov–Smirnov test) but not for the uniform model (p = 0.14, D = 0.13). The half-session between field distributions differed between the non-uniform and uniform models (p = 7.1 × 10⁻⁸, D = 0.17, KS test).

