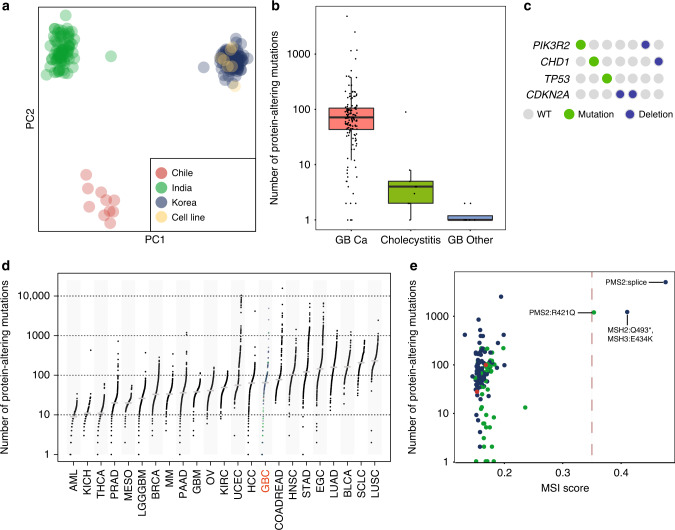
Fig. 1. Genetic variation in GBC and non-GBC samples.
a Principal Component Analysis of germline variants of GBC and non-GBC samples colored based on country of origin. b Box plot depicting the number of protein-altering mutations in GBC (n = 148), Cholecystitis (n = 9) and GB-other (n = 8) samples containing mutations (1 or more). Boxes indicate the interquartile range (IQR); center line, median; whiskers, lowest and highest values within 1.5x IQR from the first and third quartiles, respectively. c Quilt plot showing mutations in key cancer-associated genes in cholecystitis samples. Each column represents a sample. d Number of protein-altering somatic mutations in GBC compared to mesothelioma66 and 21 other cancer types. e MSI score determined by MANTIS plotted against the total number of protein-altering mutations for each GBC sample. Samples are colored based on country of origin as in panel a. MMR gene mutations identified are indicated next to the MSI positive samples.

