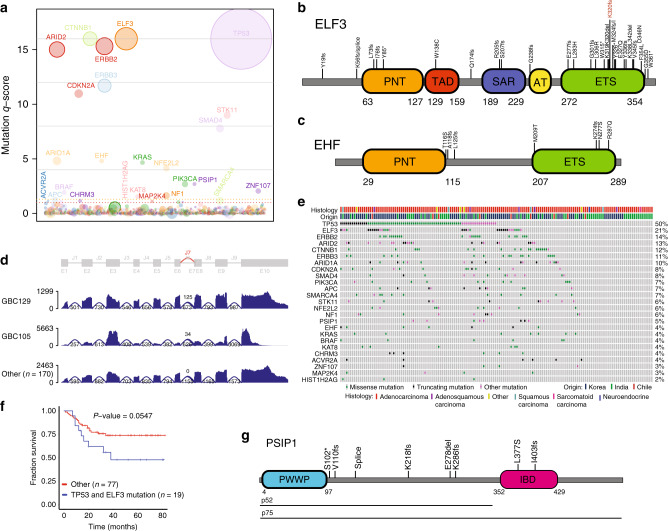
Fig. 2. Significantly mutated genes in GBC.
a Plot showing the significantly mutated GBC genes and their q-score. Each gene is represented as a circle, where the size of the circle is proportional to the observed mutation frequency. Genes are arranged along the x axis in alphabetical order. Significant q-score genes with FDR < 0.1 are indicated. Dotted orange line, FDR = 0.05, dotted red line, FDR = 0.1. Schematics showing alterations in ETS family members (b) ELF3 and (c) EHF. d ELF3 splicing defects observed in two GBC samples. e Plot representing mutations observed in SMG genes across the GBC samples. Each column represents a sample. f Kaplan–Meier survival plot of patients with tumor double positive for ELF3 and TP53 vs others. Log-rank test p values are presented for each group. g Schematic showing alterations observed in PSIP1 in GBCs.

