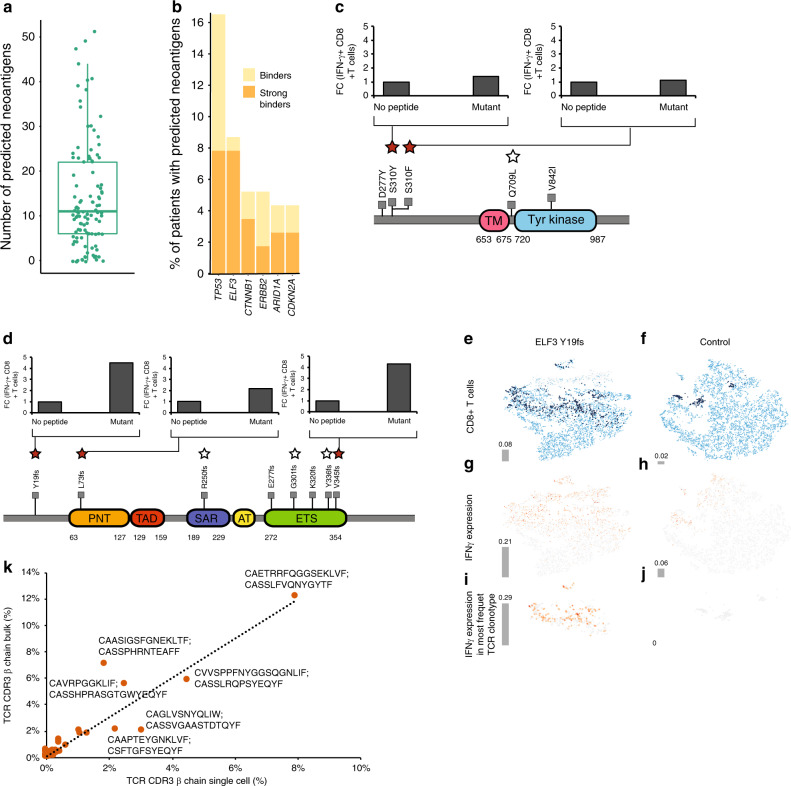
Fig. 3. Neoantigens in GBC.
a Box plot of neoantigens predicted in GBC samples (n = 110). Boxes indicate the interquartile range (IQR); center line, median; whiskers, lowest and highest values within 1.5x IQR from the first and third quartiles, respectively. b Stacked bar plot of genes with the highest number of predicted neoantigens plotted as a percentage of total number of patient tumors with a mutation in that gene (n = 43). Peptides with predicted MHC I affinty of ≤500 nm (yellow) and <500 nm (strong binder; orange) are shown in. Schematic of ERBB2 (c) or ELF3 (d) neoantigen generating mutations and CD8+ T-cell activation measured by INF-γ expression level for the indicated mutant peptides. Stars above the mutation represent peptides tested and solid stars represent CD8+ T-cell activating peptides. t-SNE plots based of single-cell RNA/TCR-seq data for CD8+ T-cells (light blue) co-cultured with dendritic cells expressing either the ELF3 Y19fs minigene (e) or control vector (f). Dark blue represents the most abundant αβ CD8 TCR clone and gray is non-CD8+ T-cells. IFN-γ expression in the total cell population primarily enriched in CD8+ T-cells in the ELF3 Y19fs minigene (g) or control vector (h) sample. i, j IFN-γ expression observed in the expanded CD8+ T-cells identified by TCR sequence analysis. k A scatter plot of correlation between the most frequently represented TCR clones identified by the TCRβ chain sequence in the single-cell and PMBC CD8+ T-cell activation assay (see Methods). The TCR α and β chain CDR3 sequence of the top six most clonally expanded T-cell clones are shown.

