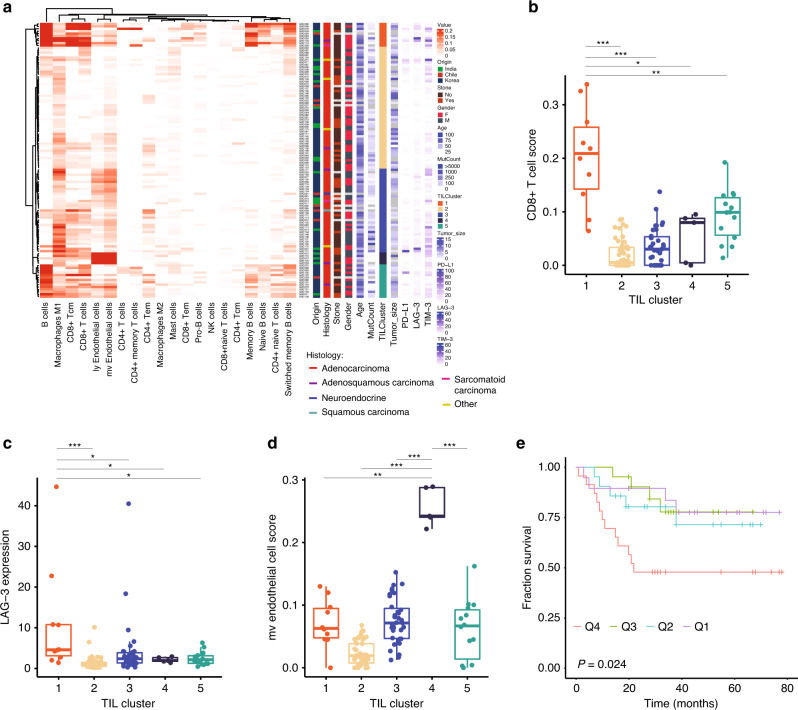
Fig. 4. Tumor-infiltrating lymphocyte cluster (TIL) in GBC samples.
a RNA-seq based determination of cell types and TIL clusters in GBC samples. TIL cluster and their CD8+ T-cell score (b; n = 115), LAG-3 expression (c; n = 115), and micro vascular (mv) endothelial cells score (d; n = 115). Boxes indicate the interquartile range (IQR); center line, median; whiskers, lowest and highest values within 1.5× IQR from the first and third quartiles, respectively. e Kaplan–Meier survival plot of GBC samples based on mv endothelial cell score quartiles (n = 21 each arm). Log-rank test p values are presented for each group (*P ≤ 0.05; **P ≤ 0.01; ***P ≤ 0.001).

