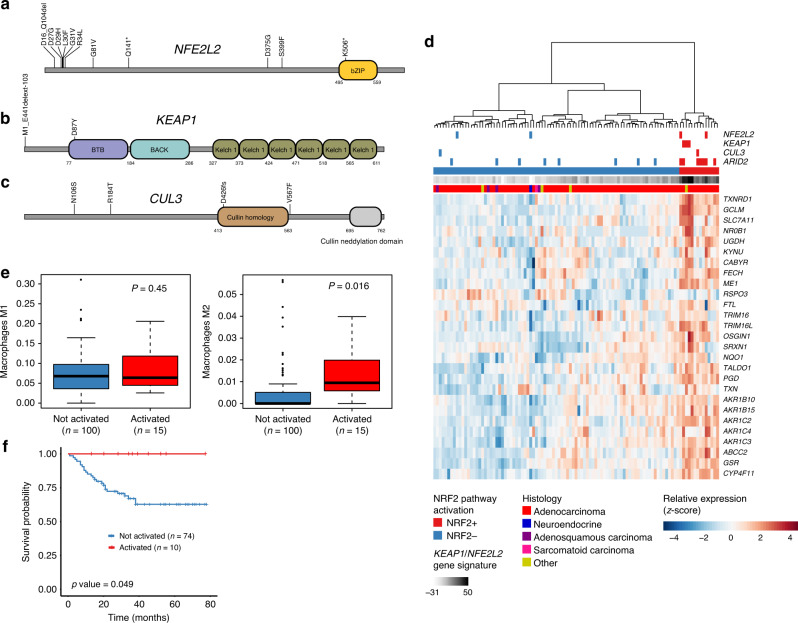
Fig. 5. KEAP1/NFE2L2 pathway activation in GBC.
Schematics of alterations in NFE2L2 (a), KEAP1 (b), CUL3 (c) from exome, and RNA-seq splicing events (n = 166). d Hierarchical clustering of GBC samples based on 27 NFE2L2 downstream target genes. Color bars at top of heatmap indicate alterations in NFE2L2, KEAP1, CUL3, ARID2, pathway activation status, and pathway activation score for samples with RNA-seq and paried exome data (n = 101). e RNA-seq estimated levels for M2 and M1 macrophages for NRF2-/NRF2 + samples (two-tailed Mann–Whitney test). f Kaplan–Meier survival plot of NRF2-/NRF2 + samples. Log-rank test p values are represented for each group.

