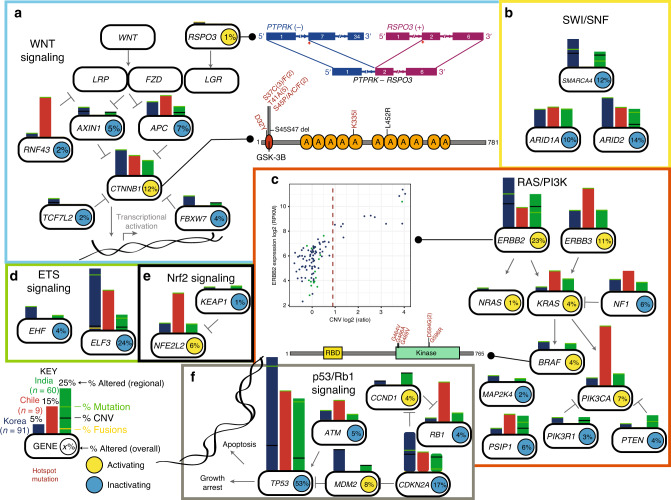
Fig. 6. Integrated analysis of pathway alterations observed in GBC.
Alterations in the WNT (a), SWI/SNF (b), RAS/PI3K (c), ETS signaling (d), Nrf2 Signaling (e), and p53/Rb1 (f) pathways. Smooth edge rectangles indicate genomically altered genes; bars indicate frequency of genomic alterations by origin (blue, Korea (n = 94); red, Chile (n = 9); green, India (n = 64)). Horizontal lines within bars indicate frequency of mutations (green), fusions (yellow) or copy number loss (black).

