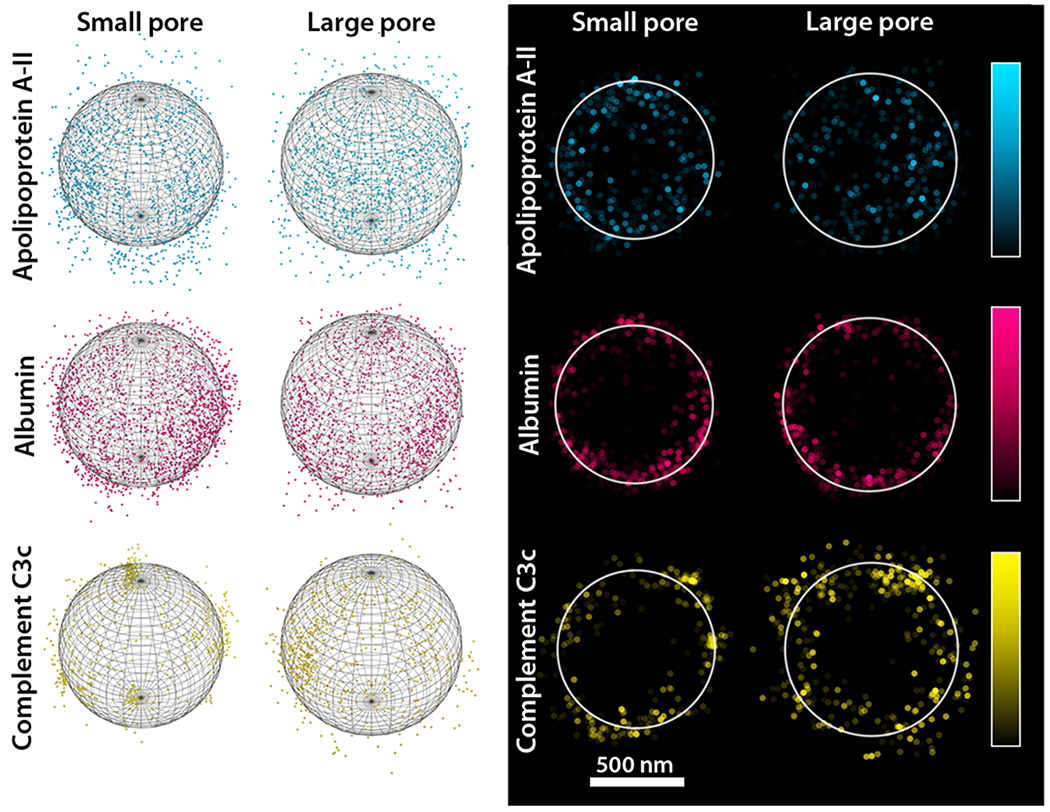
Figure 2.

Sphere fitting model and analysis on selected spheres. (Left) The sphere of best fit was determined from STORM data for three fluorescently labeled proteins, represented in dots, adsorbed onto two types of MSNs. (Right) Once the particle origin was calculated, data associated with molecules within 100 nm of the particle center (along the z-axis) were extracted, the data points were flattened and plotted as a function of their fluorescence intensity (indicated in the colored bar).
