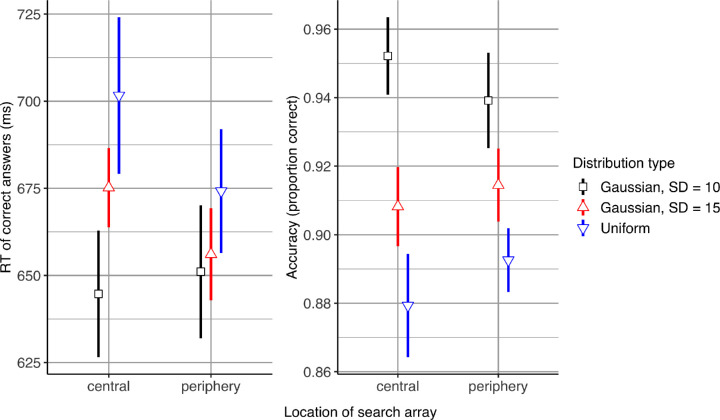
Figure 3.
Visual search performance in Experiment 1. Error bars represent 95% confidence intervals. Gaussian with SD = 10° (denoted by black) corresponds with the results obtained from the test trials, and the other two distractor distribution types (Gaussian with SD = 15° and uniform, which are denoted by red and blue respectively), correspond with the results obtained from learning trials.

